
One of the things that I miss most about attending trade shows like DAC in the old days was that you actually got to see EDA tools being demonstrated live in the exhibit area. You could see what the GUI looked like, how the dialogs worked, and learn what kind of control you could have during analysis. Most of what you see today at DAC in the exhibits are Powerpoint presentations, nothing really live anymore. Now that we have the Internet and video capabilities a few EDA companies are bringing back the concept of actually showing you what their EDA tools can perform, step by step, dialog by dialog. I’ve just watched a series of four videos at Synopsys covering the usage of their Simulation and Analysis Environment (SAE), something that any circuit designer would benefit from watching.
Advanced Testbench Setup
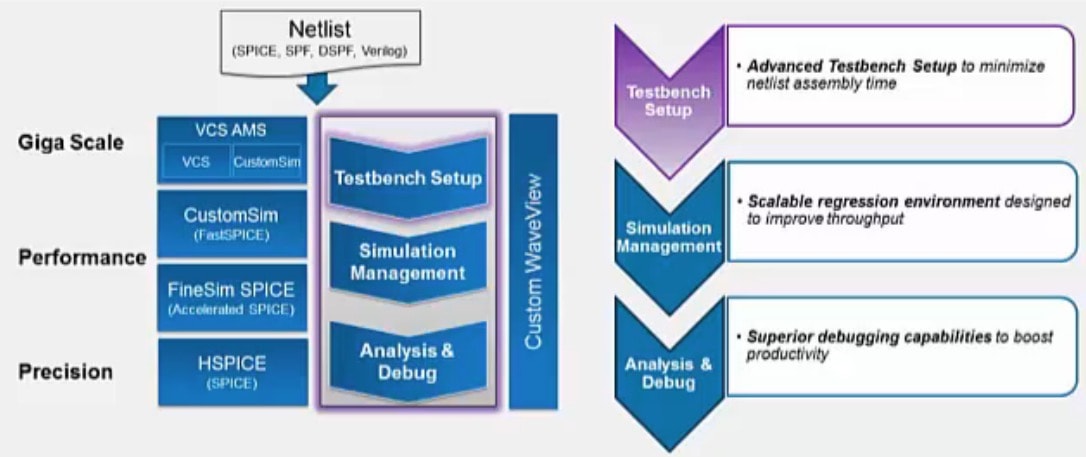
In the diagram below the purple rectangle area shows the Simulation and Analysis Environment; in the design flow it’s where you read in a netlist, choose the types of analysis that you want to perform, select which outputs to view, define any measurements, add specifications to verify that your circuit meets a criteria, launch a circuit simulator, then start analyzing the results of simulation.

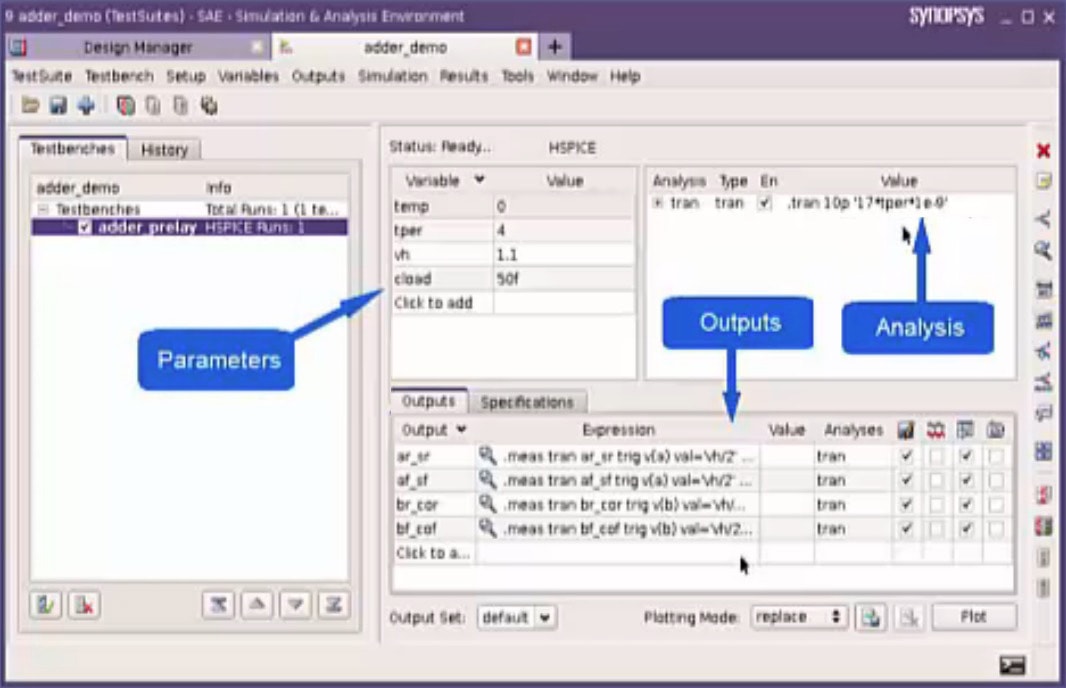
The GUI looks intuitive with areas for parameters, analysis, outputs and testbenches:
Watch Video 1
Managing Simulation ECO Flow
The second video builds upon concepts from the first one, then shows how to run a circuit simulation and then take the operating point analysis results and annotate the original netlist:
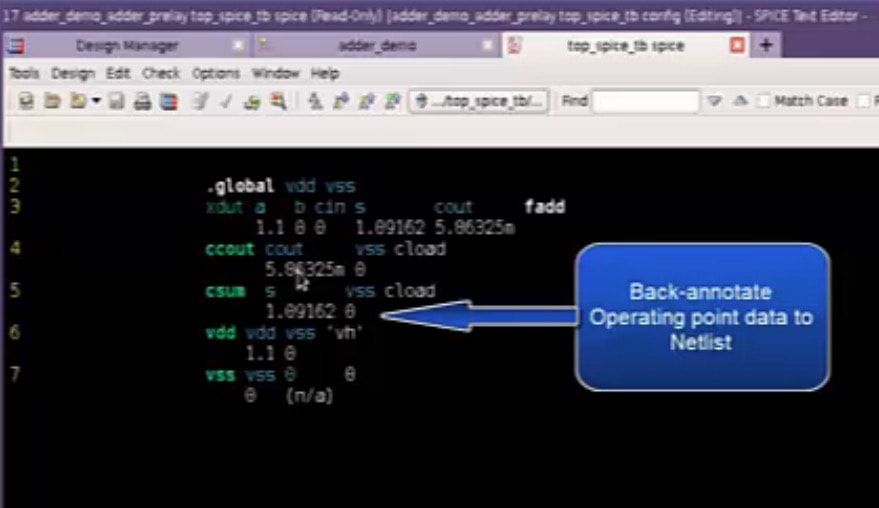
The demo shows how to change the W/L sizes in an adder circuit using the GUI, update parameters, change the testbench, then rerun the circuit simulation in just seconds.
Managing Multiple Testbenches
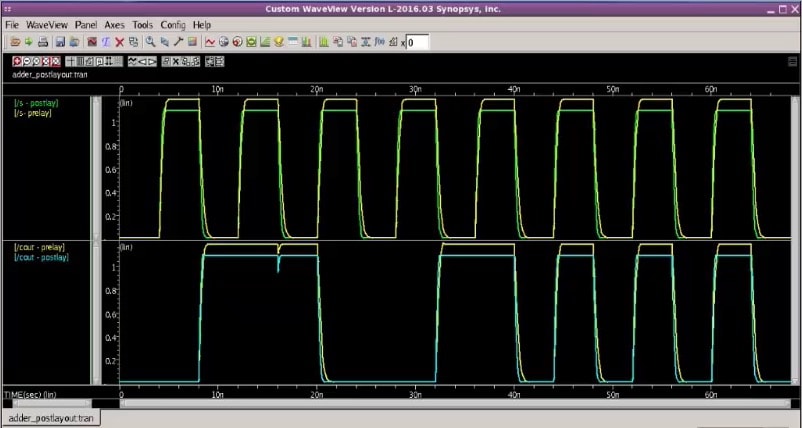
Most circuits require multiple testbenches, so this third video shows how to: clone a testbench, do remote job distribution, job policy setup, and hierarchical job monitoring. A second netlist with post-layout extracted parasitics is added to the demo circuit, then the waveform results are compared with pre-layout results:
Cloning a testbench can be used when you want to compare HSPICE versus CustomSim results on the same circuit. For the demo adder there were two testbenches using HSPICE and two testbenches using CustomSim, and all four testbenches were run in parallel while you could watch the status of simulations. You can even setup where your simulations will take place, using LSF or SGE. The job policy setup can define that long simulation runs like a PLL use a remote machine, while smaller circuits use the local host.
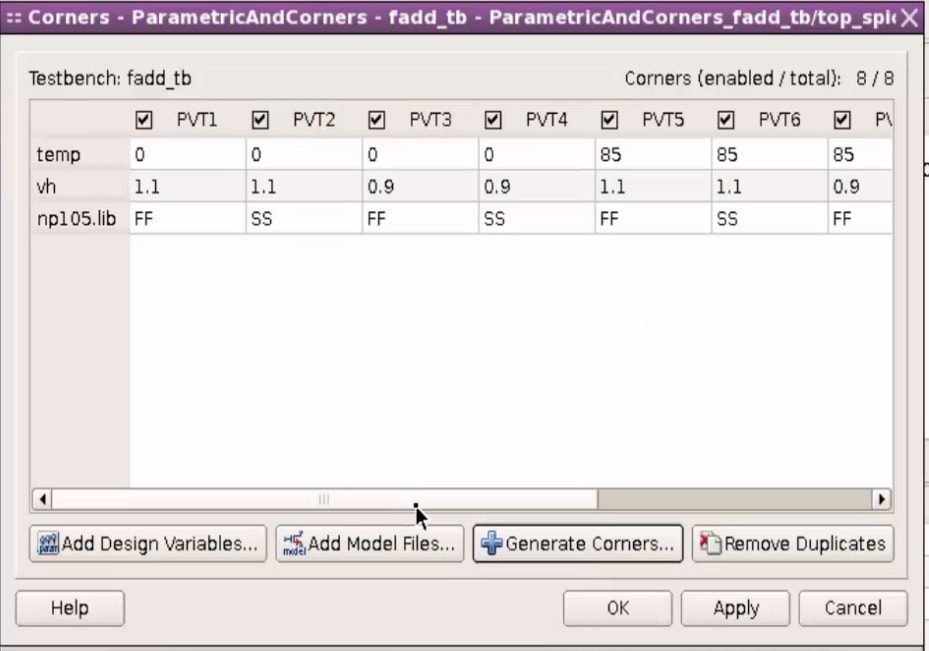
Running Parametric Sweeps and PVT Corners
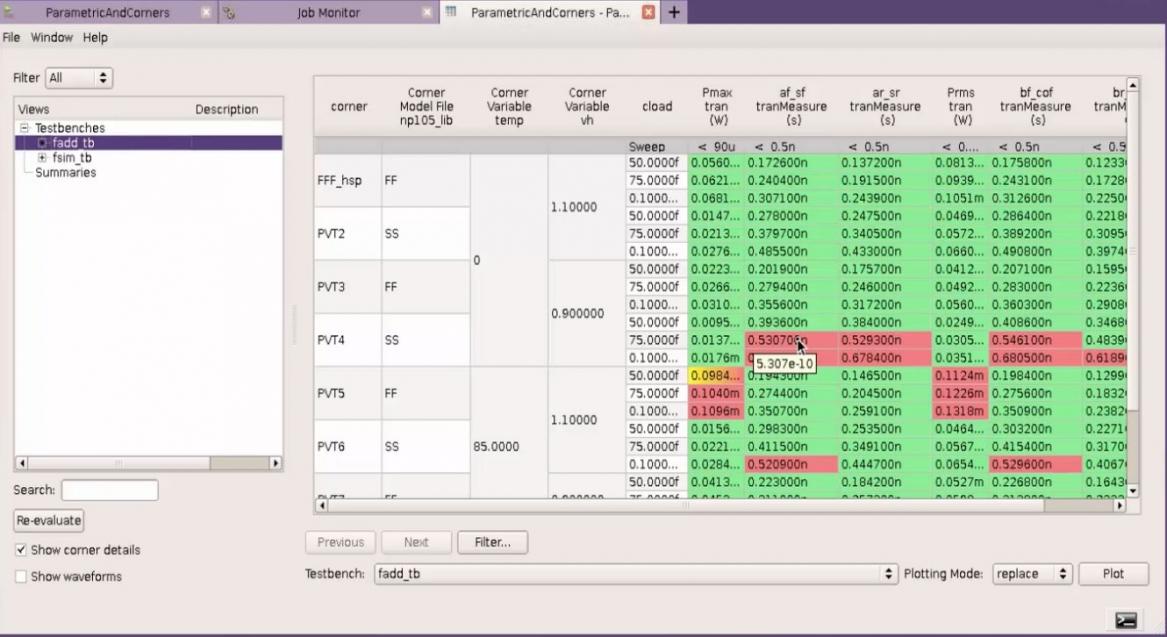
Circuit designers often want to vary parameters like load capacitor values or run PVT corners. The GUI lets you quickly define these sweeps and corners. Multiple simulations were submitted to both HSPICE and FineSim circuit simulators, and the simulation results were displayed in tabular format. The GUI to define PVT corners only takes a few clicks to setup:
24 jobs were submitted to HSPICE and 24 jobs to FineSim on a local host, then the hierarchical job monitor displayed all 48 of these jobs as they completed. Measurement results are easy to visualize across PVT corners where a green color shows a measurement that met specification, while red color shows a measurement that didn’t meet spec:
Summary
Through just four videos you get a very quick and thorough introduction on how to setup, control and analyze your circuit simulations through this new GUI called the Simulation and Analysis Environment. If you’re not familiar with SAE, then I recommend that you watch them in sequence, and each video is 15 minutes in length. There is a short sign-up form that you register with.


Comments
There are no comments yet.
You must register or log in to view/post comments.