Threads
XF\Mvc\Entity\ArrayCollection Object
(
[entities:protected] => Array
(
[20062] => ThemeHouse\XPress\XF\Entity\Thread Object
(
[_uniqueEntityId:XF\Mvc\Entity\Entity:private] => 51
[rootClass:protected] => XF\Entity\Thread
[_useReplaceInto:protected] =>
[_newValues:protected] => Array
(
)
[_values:protected] => Array
(
[thread_id] => 20062
[node_id] => 2
[title] => Timing for TSMC Wafer Orders
[reply_count] => 20
[view_count] => 1784
[user_id] => 36490
[username] => fansink
[post_date] => 1713539716
[sticky] => 0
[discussion_state] => visible
[discussion_open] => 1
[discussion_type] => discussion
[first_post_id] => 69442
[first_post_reaction_score] => 0
[first_post_reactions] => []
[last_post_date] => 1714021137
[last_post_id] => 69608
[last_post_user_id] => 38642
[last_post_username] => VCT
[prefix_id] => 0
[tags] => []
[custom_fields] => []
[vote_score] => 0
[vote_count] => 0
[type_data] => []
)
[_relations:protected] => Array
(
[User] => ThemeHouse\XLink\XF\Entity\User Object
(
[_uniqueEntityId:XF\Mvc\Entity\Entity:private] => 48
[rootClass:protected] => XF\Entity\User
[_useReplaceInto:protected] =>
[_newValues:protected] => Array
(
)
[_values:protected] => Array
(
[user_id] => 36490
[username] => fansink
[username_date] => 1633797241
[username_date_visible] => 1633786579
[email] => dt@novelconceptsinc.com
[custom_title] =>
[language_id] => 1
[style_id] => 0
[timezone] => America/Los_Angeles
[visible] => 1
[activity_visible] => 1
[user_group_id] => 2
[secondary_group_ids] =>
[display_style_group_id] => 2
[permission_combination_id] => 8
[message_count] => 183
[question_solution_count] => 0
[conversations_unread] => 0
[register_date] => 1607181097
[last_activity] => 1714014034
[last_summary_email_date] =>
[trophy_points] => 28
[alerts_unviewed] => 3
[alerts_unread] => 4
[avatar_date] => 1633786654
[avatar_width] => 384
[avatar_height] => 384
[avatar_highdpi] => 1
[gravatar] =>
[user_state] => valid
[security_lock] =>
[is_moderator] => 0
[is_admin] => 0
[is_banned] => 0
[reaction_score] => 76
[warning_points] => 0
[is_staff] => 0
[secret_key] => JnrZQ1Uify4Q71rQ2GE1O9d7OVlT2ojg
[privacy_policy_accepted] => 1607181097
[terms_accepted] => 1607181097
[vote_score] => 0
)
[_relations:protected] => Array
(
)
[_previousValues:protected] => Array
(
)
[_options:protected] => Array
(
)
[_deleted:protected] =>
[_readOnly:protected] =>
[_writePending:protected] =>
[_writeRunning:protected] =>
[_errors:protected] => Array
(
)
[_whenSaveable:protected] => Array
(
)
[_cascadeSave:protected] => Array
(
)
[_behaviors:protected] =>
)
[Forum] => XF\Entity\Forum Object
(
[_uniqueEntityId:XF\Mvc\Entity\Entity:private] => 50
[rootClass:protected] => XF\Entity\Forum
[_useReplaceInto:protected] =>
[_newValues:protected] => Array
(
)
[_values:protected] => Array
(
[node_id] => 2
[discussion_count] => 5728
[message_count] => 35429
[last_post_id] => 69608
[last_post_date] => 1714021137
[last_post_user_id] => 38642
[last_post_username] => VCT
[last_thread_id] => 20062
[last_thread_title] => Timing for TSMC Wafer Orders
[last_thread_prefix_id] => 0
[moderate_threads] => 0
[moderate_replies] => 0
[allow_posting] => 1
[count_messages] => 1
[find_new] => 1
[allow_index] => allow
[index_criteria] =>
[field_cache] => []
[prefix_cache] => []
[prompt_cache] => []
[default_prefix_id] => 0
[default_sort_order] => last_post_date
[default_sort_direction] => desc
[list_date_limit_days] => 0
[require_prefix] => 0
[allowed_watch_notifications] => all
[min_tags] => 0
[forum_type_id] => discussion
[type_config] => {"allowed_thread_types":["poll"]}
)
[_relations:protected] => Array
(
[Node] => XF\Entity\Node Object
(
[_uniqueEntityId:XF\Mvc\Entity\Entity:private] => 49
[rootClass:protected] => XF\Entity\Node
[_useReplaceInto:protected] =>
[_newValues:protected] => Array
(
)
[_values:protected] => Array
(
[node_id] => 2
[title] => SemiWiki Main Forum ( Ask the Experts! )
[description] => Post your questions to the experts here!
[node_name] =>
[node_type_id] => Forum
[parent_node_id] => 1
[display_order] => 1
[display_in_list] => 1
[lft] => 2
[rgt] => 3
[depth] => 1
[style_id] => 0
[effective_style_id] => 0
[breadcrumb_data] => {"1":{"node_id":1,"title":"Main Category","depth":0,"lft":1,"node_name":null,"node_type_id":"Category","display_in_list":true}}
[navigation_id] =>
[effective_navigation_id] =>
)
[_relations:protected] => Array
(
)
[_previousValues:protected] => Array
(
)
[_options:protected] => Array
(
)
[_deleted:protected] =>
[_readOnly:protected] =>
[_writePending:protected] =>
[_writeRunning:protected] =>
[_errors:protected] => Array
(
)
[_whenSaveable:protected] => Array
(
)
[_cascadeSave:protected] => Array
(
)
[_behaviors:protected] =>
)
)
[_previousValues:protected] => Array
(
)
[_options:protected] => Array
(
)
[_deleted:protected] =>
[_readOnly:protected] =>
[_writePending:protected] =>
[_writeRunning:protected] =>
[_errors:protected] => Array
(
)
[_whenSaveable:protected] => Array
(
)
[_cascadeSave:protected] => Array
(
)
[_behaviors:protected] =>
)
[20095] => ThemeHouse\XPress\XF\Entity\Thread Object
(
[_uniqueEntityId:XF\Mvc\Entity\Entity:private] => 55
[rootClass:protected] => XF\Entity\Thread
[_useReplaceInto:protected] =>
[_newValues:protected] => Array
(
)
[_values:protected] => Array
(
[thread_id] => 20095
[node_id] => 2
[title] => TSMC’s debacle in the American desert
Missed deadlines and tension among Taiwanese and American coworkers are plaguing the chip giant’s Phoenix expans
[reply_count] => 36
[view_count] => 848
[user_id] => 8322
[username] => hskuo
[post_date] => 1713917612
[sticky] => 0
[discussion_state] => visible
[discussion_open] => 1
[discussion_type] => discussion
[first_post_id] => 69537
[first_post_reaction_score] => 0
[first_post_reactions] => []
[last_post_date] => 1714015787
[last_post_id] => 69607
[last_post_user_id] => 170880
[last_post_username] => nghanayem
[prefix_id] => 0
[tags] => []
[custom_fields] => []
[vote_score] => 0
[vote_count] => 0
[type_data] => []
)
[_relations:protected] => Array
(
[User] => ThemeHouse\XLink\XF\Entity\User Object
(
[_uniqueEntityId:XF\Mvc\Entity\Entity:private] => 52
[rootClass:protected] => XF\Entity\User
[_useReplaceInto:protected] =>
[_newValues:protected] => Array
(
)
[_values:protected] => Array
(
[user_id] => 8322
[username] => hskuo
[username_date] => 0
[username_date_visible] => 0
[email] => h_s_kuo@yahoo.com.tw
[custom_title] =>
[language_id] => 1
[style_id] => 0
[timezone] => Asia/Singapore
[visible] => 0
[activity_visible] => 0
[user_group_id] => 2
[secondary_group_ids] =>
[display_style_group_id] => 2
[permission_combination_id] => 8
[message_count] => 324
[question_solution_count] => 0
[conversations_unread] => 0
[register_date] => 1353653082
[last_activity] => 1714008077
[last_summary_email_date] =>
[trophy_points] => 63
[alerts_unviewed] => 0
[alerts_unread] => 0
[avatar_date] => 0
[avatar_width] => 0
[avatar_height] => 0
[avatar_highdpi] => 0
[gravatar] =>
[user_state] => valid
[security_lock] =>
[is_moderator] => 0
[is_admin] => 0
[is_banned] => 0
[reaction_score] => 273
[warning_points] => 0
[is_staff] => 0
[secret_key] => dmSCPzj7nJ30LudrsWqXuEY0wtWsm9Z5
[privacy_policy_accepted] => 0
[terms_accepted] => 0
[vote_score] => 0
)
[_relations:protected] => Array
(
)
[_previousValues:protected] => Array
(
)
[_options:protected] => Array
(
)
[_deleted:protected] =>
[_readOnly:protected] =>
[_writePending:protected] =>
[_writeRunning:protected] =>
[_errors:protected] => Array
(
)
[_whenSaveable:protected] => Array
(
)
[_cascadeSave:protected] => Array
(
)
[_behaviors:protected] =>
)
[Forum] => XF\Entity\Forum Object
(
[_uniqueEntityId:XF\Mvc\Entity\Entity:private] => 50
[rootClass:protected] => XF\Entity\Forum
[_useReplaceInto:protected] =>
[_newValues:protected] => Array
(
)
[_values:protected] => Array
(
[node_id] => 2
[discussion_count] => 5728
[message_count] => 35429
[last_post_id] => 69608
[last_post_date] => 1714021137
[last_post_user_id] => 38642
[last_post_username] => VCT
[last_thread_id] => 20062
[last_thread_title] => Timing for TSMC Wafer Orders
[last_thread_prefix_id] => 0
[moderate_threads] => 0
[moderate_replies] => 0
[allow_posting] => 1
[count_messages] => 1
[find_new] => 1
[allow_index] => allow
[index_criteria] =>
[field_cache] => []
[prefix_cache] => []
[prompt_cache] => []
[default_prefix_id] => 0
[default_sort_order] => last_post_date
[default_sort_direction] => desc
[list_date_limit_days] => 0
[require_prefix] => 0
[allowed_watch_notifications] => all
[min_tags] => 0
[forum_type_id] => discussion
[type_config] => {"allowed_thread_types":["poll"]}
)
[_relations:protected] => Array
(
[Node] => XF\Entity\Node Object
(
[_uniqueEntityId:XF\Mvc\Entity\Entity:private] => 49
[rootClass:protected] => XF\Entity\Node
[_useReplaceInto:protected] =>
[_newValues:protected] => Array
(
)
[_values:protected] => Array
(
[node_id] => 2
[title] => SemiWiki Main Forum ( Ask the Experts! )
[description] => Post your questions to the experts here!
[node_name] =>
[node_type_id] => Forum
[parent_node_id] => 1
[display_order] => 1
[display_in_list] => 1
[lft] => 2
[rgt] => 3
[depth] => 1
[style_id] => 0
[effective_style_id] => 0
[breadcrumb_data] => {"1":{"node_id":1,"title":"Main Category","depth":0,"lft":1,"node_name":null,"node_type_id":"Category","display_in_list":true}}
[navigation_id] =>
[effective_navigation_id] =>
)
[_relations:protected] => Array
(
)
[_previousValues:protected] => Array
(
)
[_options:protected] => Array
(
)
[_deleted:protected] =>
[_readOnly:protected] =>
[_writePending:protected] =>
[_writeRunning:protected] =>
[_errors:protected] => Array
(
)
[_whenSaveable:protected] => Array
(
)
[_cascadeSave:protected] => Array
(
)
[_behaviors:protected] =>
)
)
[_previousValues:protected] => Array
(
)
[_options:protected] => Array
(
)
[_deleted:protected] =>
[_readOnly:protected] =>
[_writePending:protected] =>
[_writeRunning:protected] =>
[_errors:protected] => Array
(
)
[_whenSaveable:protected] => Array
(
)
[_cascadeSave:protected] => Array
(
)
[_behaviors:protected] =>
)
)
[_previousValues:protected] => Array
(
)
[_options:protected] => Array
(
)
[_deleted:protected] =>
[_readOnly:protected] =>
[_writePending:protected] =>
[_writeRunning:protected] =>
[_errors:protected] => Array
(
)
[_whenSaveable:protected] => Array
(
)
[_cascadeSave:protected] => Array
(
)
[_behaviors:protected] =>
)
[20108] => ThemeHouse\XPress\XF\Entity\Thread Object
(
[_uniqueEntityId:XF\Mvc\Entity\Entity:private] => 59
[rootClass:protected] => XF\Entity\Thread
[_useReplaceInto:protected] =>
[_newValues:protected] => Array
(
)
[_values:protected] => Array
(
[thread_id] => 20108
[node_id] => 2
[title] => Advanced Insights Ep. 3: Dr. Y. J. Mii on 2nm and Beyond
[reply_count] => 5
[view_count] => 211
[user_id] => 8322
[username] => hskuo
[post_date] => 1713999648
[sticky] => 0
[discussion_state] => visible
[discussion_open] => 1
[discussion_type] => discussion
[first_post_id] => 69582
[first_post_reaction_score] => 1
[first_post_reactions] => {"1":1}
[last_post_date] => 1714012399
[last_post_id] => 69603
[last_post_user_id] => 5
[last_post_username] => Daniel Nenni
[prefix_id] => 0
[tags] => []
[custom_fields] => []
[vote_score] => 0
[vote_count] => 0
[type_data] => []
)
[_relations:protected] => Array
(
[User] => ThemeHouse\XLink\XF\Entity\User Object
(
[_uniqueEntityId:XF\Mvc\Entity\Entity:private] => 52
[rootClass:protected] => XF\Entity\User
[_useReplaceInto:protected] =>
[_newValues:protected] => Array
(
)
[_values:protected] => Array
(
[user_id] => 8322
[username] => hskuo
[username_date] => 0
[username_date_visible] => 0
[email] => h_s_kuo@yahoo.com.tw
[custom_title] =>
[language_id] => 1
[style_id] => 0
[timezone] => Asia/Singapore
[visible] => 0
[activity_visible] => 0
[user_group_id] => 2
[secondary_group_ids] =>
[display_style_group_id] => 2
[permission_combination_id] => 8
[message_count] => 324
[question_solution_count] => 0
[conversations_unread] => 0
[register_date] => 1353653082
[last_activity] => 1714008077
[last_summary_email_date] =>
[trophy_points] => 63
[alerts_unviewed] => 0
[alerts_unread] => 0
[avatar_date] => 0
[avatar_width] => 0
[avatar_height] => 0
[avatar_highdpi] => 0
[gravatar] =>
[user_state] => valid
[security_lock] =>
[is_moderator] => 0
[is_admin] => 0
[is_banned] => 0
[reaction_score] => 273
[warning_points] => 0
[is_staff] => 0
[secret_key] => dmSCPzj7nJ30LudrsWqXuEY0wtWsm9Z5
[privacy_policy_accepted] => 0
[terms_accepted] => 0
[vote_score] => 0
)
[_relations:protected] => Array
(
)
[_previousValues:protected] => Array
(
)
[_options:protected] => Array
(
)
[_deleted:protected] =>
[_readOnly:protected] =>
[_writePending:protected] =>
[_writeRunning:protected] =>
[_errors:protected] => Array
(
)
[_whenSaveable:protected] => Array
(
)
[_cascadeSave:protected] => Array
(
)
[_behaviors:protected] =>
)
[Forum] => XF\Entity\Forum Object
(
[_uniqueEntityId:XF\Mvc\Entity\Entity:private] => 50
[rootClass:protected] => XF\Entity\Forum
[_useReplaceInto:protected] =>
[_newValues:protected] => Array
(
)
[_values:protected] => Array
(
[node_id] => 2
[discussion_count] => 5728
[message_count] => 35429
[last_post_id] => 69608
[last_post_date] => 1714021137
[last_post_user_id] => 38642
[last_post_username] => VCT
[last_thread_id] => 20062
[last_thread_title] => Timing for TSMC Wafer Orders
[last_thread_prefix_id] => 0
[moderate_threads] => 0
[moderate_replies] => 0
[allow_posting] => 1
[count_messages] => 1
[find_new] => 1
[allow_index] => allow
[index_criteria] =>
[field_cache] => []
[prefix_cache] => []
[prompt_cache] => []
[default_prefix_id] => 0
[default_sort_order] => last_post_date
[default_sort_direction] => desc
[list_date_limit_days] => 0
[require_prefix] => 0
[allowed_watch_notifications] => all
[min_tags] => 0
[forum_type_id] => discussion
[type_config] => {"allowed_thread_types":["poll"]}
)
[_relations:protected] => Array
(
[Node] => XF\Entity\Node Object
(
[_uniqueEntityId:XF\Mvc\Entity\Entity:private] => 49
[rootClass:protected] => XF\Entity\Node
[_useReplaceInto:protected] =>
[_newValues:protected] => Array
(
)
[_values:protected] => Array
(
[node_id] => 2
[title] => SemiWiki Main Forum ( Ask the Experts! )
[description] => Post your questions to the experts here!
[node_name] =>
[node_type_id] => Forum
[parent_node_id] => 1
[display_order] => 1
[display_in_list] => 1
[lft] => 2
[rgt] => 3
[depth] => 1
[style_id] => 0
[effective_style_id] => 0
[breadcrumb_data] => {"1":{"node_id":1,"title":"Main Category","depth":0,"lft":1,"node_name":null,"node_type_id":"Category","display_in_list":true}}
[navigation_id] =>
[effective_navigation_id] =>
)
[_relations:protected] => Array
(
)
[_previousValues:protected] => Array
(
)
[_options:protected] => Array
(
)
[_deleted:protected] =>
[_readOnly:protected] =>
[_writePending:protected] =>
[_writeRunning:protected] =>
[_errors:protected] => Array
(
)
[_whenSaveable:protected] => Array
(
)
[_cascadeSave:protected] => Array
(
)
[_behaviors:protected] =>
)
)
[_previousValues:protected] => Array
(
)
[_options:protected] => Array
(
)
[_deleted:protected] =>
[_readOnly:protected] =>
[_writePending:protected] =>
[_writeRunning:protected] =>
[_errors:protected] => Array
(
)
[_whenSaveable:protected] => Array
(
)
[_cascadeSave:protected] => Array
(
)
[_behaviors:protected] =>
)
)
[_previousValues:protected] => Array
(
)
[_options:protected] => Array
(
)
[_deleted:protected] =>
[_readOnly:protected] =>
[_writePending:protected] =>
[_writeRunning:protected] =>
[_errors:protected] => Array
(
)
[_whenSaveable:protected] => Array
(
)
[_cascadeSave:protected] => Array
(
)
[_behaviors:protected] =>
)
[20109] => ThemeHouse\XPress\XF\Entity\Thread Object
(
[_uniqueEntityId:XF\Mvc\Entity\Entity:private] => 63
[rootClass:protected] => XF\Entity\Thread
[_useReplaceInto:protected] =>
[_newValues:protected] => Array
(
)
[_values:protected] => Array
(
[thread_id] => 20109
[node_id] => 2
[title] => TSMC says 'A16' chipmaking tech to arrive in 2026, setting up showdown with Intel
[reply_count] => 5
[view_count] => 174
[user_id] => 5
[username] => Daniel Nenni
[post_date] => 1714006061
[sticky] => 0
[discussion_state] => visible
[discussion_open] => 1
[discussion_type] => discussion
[first_post_id] => 69590
[first_post_reaction_score] => 1
[first_post_reactions] => {"1":1}
[last_post_date] => 1714011441
[last_post_id] => 69600
[last_post_user_id] => 322214
[last_post_username] => Mooredaddy
[prefix_id] => 0
[tags] => []
[custom_fields] => []
[vote_score] => 0
[vote_count] => 0
[type_data] => []
)
[_relations:protected] => Array
(
[User] => ThemeHouse\XLink\XF\Entity\User Object
(
[_uniqueEntityId:XF\Mvc\Entity\Entity:private] => 60
[rootClass:protected] => XF\Entity\User
[_useReplaceInto:protected] =>
[_newValues:protected] => Array
(
)
[_values:protected] => Array
(
[user_id] => 5
[username] => Daniel Nenni
[username_date] => 0
[username_date_visible] => 0
[email] => dnenni@semiwiki.com
[custom_title] => Admin
[language_id] => 1
[style_id] => 0
[timezone] => America/Los_Angeles
[visible] => 1
[activity_visible] => 1
[user_group_id] => 3
[secondary_group_ids] => 4,5,132
[display_style_group_id] => 3
[permission_combination_id] => 88
[message_count] => 11330
[question_solution_count] => 0
[conversations_unread] => 1
[register_date] => 1280720820
[last_activity] => 1714013314
[last_summary_email_date] => 1605968657
[trophy_points] => 113
[alerts_unviewed] => 25
[alerts_unread] => 25
[avatar_date] => 1663211649
[avatar_width] => 110
[avatar_height] => 107
[avatar_highdpi] => 0
[gravatar] =>
[user_state] => valid
[security_lock] =>
[is_moderator] => 1
[is_admin] => 1
[is_banned] => 0
[reaction_score] => 3387
[warning_points] => 0
[is_staff] => 1
[secret_key] => 0HwyUVVHCwJotUUVEpvqAclfYJdGNPpw
[privacy_policy_accepted] => 0
[terms_accepted] => 0
[vote_score] => 0
)
[_relations:protected] => Array
(
)
[_previousValues:protected] => Array
(
)
[_options:protected] => Array
(
)
[_deleted:protected] =>
[_readOnly:protected] =>
[_writePending:protected] =>
[_writeRunning:protected] =>
[_errors:protected] => Array
(
)
[_whenSaveable:protected] => Array
(
)
[_cascadeSave:protected] => Array
(
)
[_behaviors:protected] =>
)
[Forum] => XF\Entity\Forum Object
(
[_uniqueEntityId:XF\Mvc\Entity\Entity:private] => 50
[rootClass:protected] => XF\Entity\Forum
[_useReplaceInto:protected] =>
[_newValues:protected] => Array
(
)
[_values:protected] => Array
(
[node_id] => 2
[discussion_count] => 5728
[message_count] => 35429
[last_post_id] => 69608
[last_post_date] => 1714021137
[last_post_user_id] => 38642
[last_post_username] => VCT
[last_thread_id] => 20062
[last_thread_title] => Timing for TSMC Wafer Orders
[last_thread_prefix_id] => 0
[moderate_threads] => 0
[moderate_replies] => 0
[allow_posting] => 1
[count_messages] => 1
[find_new] => 1
[allow_index] => allow
[index_criteria] =>
[field_cache] => []
[prefix_cache] => []
[prompt_cache] => []
[default_prefix_id] => 0
[default_sort_order] => last_post_date
[default_sort_direction] => desc
[list_date_limit_days] => 0
[require_prefix] => 0
[allowed_watch_notifications] => all
[min_tags] => 0
[forum_type_id] => discussion
[type_config] => {"allowed_thread_types":["poll"]}
)
[_relations:protected] => Array
(
[Node] => XF\Entity\Node Object
(
[_uniqueEntityId:XF\Mvc\Entity\Entity:private] => 49
[rootClass:protected] => XF\Entity\Node
[_useReplaceInto:protected] =>
[_newValues:protected] => Array
(
)
[_values:protected] => Array
(
[node_id] => 2
[title] => SemiWiki Main Forum ( Ask the Experts! )
[description] => Post your questions to the experts here!
[node_name] =>
[node_type_id] => Forum
[parent_node_id] => 1
[display_order] => 1
[display_in_list] => 1
[lft] => 2
[rgt] => 3
[depth] => 1
[style_id] => 0
[effective_style_id] => 0
[breadcrumb_data] => {"1":{"node_id":1,"title":"Main Category","depth":0,"lft":1,"node_name":null,"node_type_id":"Category","display_in_list":true}}
[navigation_id] =>
[effective_navigation_id] =>
)
[_relations:protected] => Array
(
)
[_previousValues:protected] => Array
(
)
[_options:protected] => Array
(
)
[_deleted:protected] =>
[_readOnly:protected] =>
[_writePending:protected] =>
[_writeRunning:protected] =>
[_errors:protected] => Array
(
)
[_whenSaveable:protected] => Array
(
)
[_cascadeSave:protected] => Array
(
)
[_behaviors:protected] =>
)
)
[_previousValues:protected] => Array
(
)
[_options:protected] => Array
(
)
[_deleted:protected] =>
[_readOnly:protected] =>
[_writePending:protected] =>
[_writeRunning:protected] =>
[_errors:protected] => Array
(
)
[_whenSaveable:protected] => Array
(
)
[_cascadeSave:protected] => Array
(
)
[_behaviors:protected] =>
)
)
[_previousValues:protected] => Array
(
)
[_options:protected] => Array
(
)
[_deleted:protected] =>
[_readOnly:protected] =>
[_writePending:protected] =>
[_writeRunning:protected] =>
[_errors:protected] => Array
(
)
[_whenSaveable:protected] => Array
(
)
[_cascadeSave:protected] => Array
(
)
[_behaviors:protected] =>
)
[20072] => ThemeHouse\XPress\XF\Entity\Thread Object
(
[_uniqueEntityId:XF\Mvc\Entity\Entity:private] => 67
[rootClass:protected] => XF\Entity\Thread
[_useReplaceInto:protected] =>
[_newValues:protected] => Array
(
)
[_values:protected] => Array
(
[thread_id] => 20072
[node_id] => 2
[title] => Huawei Pura 70 smartphone sales start; chip still a mystery
[reply_count] => 1
[view_count] => 677
[user_id] => 5185
[username] => Fred Chen
[post_date] => 1713624875
[sticky] => 0
[discussion_state] => visible
[discussion_open] => 1
[discussion_type] => discussion
[first_post_id] => 69460
[first_post_reaction_score] => 0
[first_post_reactions] => []
[last_post_date] => 1714010399
[last_post_id] => 69597
[last_post_user_id] => 29441
[last_post_username] => tonyget
[prefix_id] => 0
[tags] => []
[custom_fields] => []
[vote_score] => 0
[vote_count] => 0
[type_data] => []
)
[_relations:protected] => Array
(
[User] => ThemeHouse\XLink\XF\Entity\User Object
(
[_uniqueEntityId:XF\Mvc\Entity\Entity:private] => 64
[rootClass:protected] => XF\Entity\User
[_useReplaceInto:protected] =>
[_newValues:protected] => Array
(
)
[_values:protected] => Array
(
[user_id] => 5185
[username] => Fred Chen
[username_date] => 0
[username_date_visible] => 0
[email] => chen.t.fred@gmail.com
[custom_title] =>
[language_id] => 1
[style_id] => 0
[timezone] => America/Los_Angeles
[visible] => 1
[activity_visible] => 1
[user_group_id] => 4
[secondary_group_ids] =>
[display_style_group_id] => 4
[permission_combination_id] => 92
[message_count] => 1712
[question_solution_count] => 0
[conversations_unread] => 0
[register_date] => 1333032401
[last_activity] => 1714013130
[last_summary_email_date] => 1605940563
[trophy_points] => 113
[alerts_unviewed] => 0
[alerts_unread] => 0
[avatar_date] => 0
[avatar_width] => 0
[avatar_height] => 0
[avatar_highdpi] => 0
[gravatar] =>
[user_state] => valid
[security_lock] =>
[is_moderator] => 0
[is_admin] => 0
[is_banned] => 0
[reaction_score] => 815
[warning_points] => 0
[is_staff] => 0
[secret_key] => 5m-bZq0HRSi9VA-96QONHJeevdQas5S8
[privacy_policy_accepted] => 0
[terms_accepted] => 0
[vote_score] => 0
)
[_relations:protected] => Array
(
)
[_previousValues:protected] => Array
(
)
[_options:protected] => Array
(
)
[_deleted:protected] =>
[_readOnly:protected] =>
[_writePending:protected] =>
[_writeRunning:protected] =>
[_errors:protected] => Array
(
)
[_whenSaveable:protected] => Array
(
)
[_cascadeSave:protected] => Array
(
)
[_behaviors:protected] =>
)
[Forum] => XF\Entity\Forum Object
(
[_uniqueEntityId:XF\Mvc\Entity\Entity:private] => 50
[rootClass:protected] => XF\Entity\Forum
[_useReplaceInto:protected] =>
[_newValues:protected] => Array
(
)
[_values:protected] => Array
(
[node_id] => 2
[discussion_count] => 5728
[message_count] => 35429
[last_post_id] => 69608
[last_post_date] => 1714021137
[last_post_user_id] => 38642
[last_post_username] => VCT
[last_thread_id] => 20062
[last_thread_title] => Timing for TSMC Wafer Orders
[last_thread_prefix_id] => 0
[moderate_threads] => 0
[moderate_replies] => 0
[allow_posting] => 1
[count_messages] => 1
[find_new] => 1
[allow_index] => allow
[index_criteria] =>
[field_cache] => []
[prefix_cache] => []
[prompt_cache] => []
[default_prefix_id] => 0
[default_sort_order] => last_post_date
[default_sort_direction] => desc
[list_date_limit_days] => 0
[require_prefix] => 0
[allowed_watch_notifications] => all
[min_tags] => 0
[forum_type_id] => discussion
[type_config] => {"allowed_thread_types":["poll"]}
)
[_relations:protected] => Array
(
[Node] => XF\Entity\Node Object
(
[_uniqueEntityId:XF\Mvc\Entity\Entity:private] => 49
[rootClass:protected] => XF\Entity\Node
[_useReplaceInto:protected] =>
[_newValues:protected] => Array
(
)
[_values:protected] => Array
(
[node_id] => 2
[title] => SemiWiki Main Forum ( Ask the Experts! )
[description] => Post your questions to the experts here!
[node_name] =>
[node_type_id] => Forum
[parent_node_id] => 1
[display_order] => 1
[display_in_list] => 1
[lft] => 2
[rgt] => 3
[depth] => 1
[style_id] => 0
[effective_style_id] => 0
[breadcrumb_data] => {"1":{"node_id":1,"title":"Main Category","depth":0,"lft":1,"node_name":null,"node_type_id":"Category","display_in_list":true}}
[navigation_id] =>
[effective_navigation_id] =>
)
[_relations:protected] => Array
(
)
[_previousValues:protected] => Array
(
)
[_options:protected] => Array
(
)
[_deleted:protected] =>
[_readOnly:protected] =>
[_writePending:protected] =>
[_writeRunning:protected] =>
[_errors:protected] => Array
(
)
[_whenSaveable:protected] => Array
(
)
[_cascadeSave:protected] => Array
(
)
[_behaviors:protected] =>
)
)
[_previousValues:protected] => Array
(
)
[_options:protected] => Array
(
)
[_deleted:protected] =>
[_readOnly:protected] =>
[_writePending:protected] =>
[_writeRunning:protected] =>
[_errors:protected] => Array
(
)
[_whenSaveable:protected] => Array
(
)
[_cascadeSave:protected] => Array
(
)
[_behaviors:protected] =>
)
)
[_previousValues:protected] => Array
(
)
[_options:protected] => Array
(
)
[_deleted:protected] =>
[_readOnly:protected] =>
[_writePending:protected] =>
[_writeRunning:protected] =>
[_errors:protected] => Array
(
)
[_whenSaveable:protected] => Array
(
)
[_cascadeSave:protected] => Array
(
)
[_behaviors:protected] =>
)
[20107] => ThemeHouse\XPress\XF\Entity\Thread Object
(
[_uniqueEntityId:XF\Mvc\Entity\Entity:private] => 71
[rootClass:protected] => XF\Entity\Thread
[_useReplaceInto:protected] =>
[_newValues:protected] => Array
(
)
[_values:protected] => Array
(
[thread_id] => 20107
[node_id] => 2
[title] => TSMC Celebrates 30th North America Technology Symposium with Innovations Powering AI with Silicon Leadership
[reply_count] => 0
[view_count] => 92
[user_id] => 5
[username] => Daniel Nenni
[post_date] => 1713996587
[sticky] => 0
[discussion_state] => visible
[discussion_open] => 1
[discussion_type] => discussion
[first_post_id] => 69577
[first_post_reaction_score] => 1
[first_post_reactions] => {"1":1}
[last_post_date] => 1713996587
[last_post_id] => 69577
[last_post_user_id] => 5
[last_post_username] => Daniel Nenni
[prefix_id] => 0
[tags] => []
[custom_fields] => []
[vote_score] => 0
[vote_count] => 0
[type_data] => []
)
[_relations:protected] => Array
(
[User] => ThemeHouse\XLink\XF\Entity\User Object
(
[_uniqueEntityId:XF\Mvc\Entity\Entity:private] => 60
[rootClass:protected] => XF\Entity\User
[_useReplaceInto:protected] =>
[_newValues:protected] => Array
(
)
[_values:protected] => Array
(
[user_id] => 5
[username] => Daniel Nenni
[username_date] => 0
[username_date_visible] => 0
[email] => dnenni@semiwiki.com
[custom_title] => Admin
[language_id] => 1
[style_id] => 0
[timezone] => America/Los_Angeles
[visible] => 1
[activity_visible] => 1
[user_group_id] => 3
[secondary_group_ids] => 4,5,132
[display_style_group_id] => 3
[permission_combination_id] => 88
[message_count] => 11330
[question_solution_count] => 0
[conversations_unread] => 1
[register_date] => 1280720820
[last_activity] => 1714013314
[last_summary_email_date] => 1605968657
[trophy_points] => 113
[alerts_unviewed] => 25
[alerts_unread] => 25
[avatar_date] => 1663211649
[avatar_width] => 110
[avatar_height] => 107
[avatar_highdpi] => 0
[gravatar] =>
[user_state] => valid
[security_lock] =>
[is_moderator] => 1
[is_admin] => 1
[is_banned] => 0
[reaction_score] => 3387
[warning_points] => 0
[is_staff] => 1
[secret_key] => 0HwyUVVHCwJotUUVEpvqAclfYJdGNPpw
[privacy_policy_accepted] => 0
[terms_accepted] => 0
[vote_score] => 0
)
[_relations:protected] => Array
(
)
[_previousValues:protected] => Array
(
)
[_options:protected] => Array
(
)
[_deleted:protected] =>
[_readOnly:protected] =>
[_writePending:protected] =>
[_writeRunning:protected] =>
[_errors:protected] => Array
(
)
[_whenSaveable:protected] => Array
(
)
[_cascadeSave:protected] => Array
(
)
[_behaviors:protected] =>
)
[Forum] => XF\Entity\Forum Object
(
[_uniqueEntityId:XF\Mvc\Entity\Entity:private] => 50
[rootClass:protected] => XF\Entity\Forum
[_useReplaceInto:protected] =>
[_newValues:protected] => Array
(
)
[_values:protected] => Array
(
[node_id] => 2
[discussion_count] => 5728
[message_count] => 35429
[last_post_id] => 69608
[last_post_date] => 1714021137
[last_post_user_id] => 38642
[last_post_username] => VCT
[last_thread_id] => 20062
[last_thread_title] => Timing for TSMC Wafer Orders
[last_thread_prefix_id] => 0
[moderate_threads] => 0
[moderate_replies] => 0
[allow_posting] => 1
[count_messages] => 1
[find_new] => 1
[allow_index] => allow
[index_criteria] =>
[field_cache] => []
[prefix_cache] => []
[prompt_cache] => []
[default_prefix_id] => 0
[default_sort_order] => last_post_date
[default_sort_direction] => desc
[list_date_limit_days] => 0
[require_prefix] => 0
[allowed_watch_notifications] => all
[min_tags] => 0
[forum_type_id] => discussion
[type_config] => {"allowed_thread_types":["poll"]}
)
[_relations:protected] => Array
(
[Node] => XF\Entity\Node Object
(
[_uniqueEntityId:XF\Mvc\Entity\Entity:private] => 49
[rootClass:protected] => XF\Entity\Node
[_useReplaceInto:protected] =>
[_newValues:protected] => Array
(
)
[_values:protected] => Array
(
[node_id] => 2
[title] => SemiWiki Main Forum ( Ask the Experts! )
[description] => Post your questions to the experts here!
[node_name] =>
[node_type_id] => Forum
[parent_node_id] => 1
[display_order] => 1
[display_in_list] => 1
[lft] => 2
[rgt] => 3
[depth] => 1
[style_id] => 0
[effective_style_id] => 0
[breadcrumb_data] => {"1":{"node_id":1,"title":"Main Category","depth":0,"lft":1,"node_name":null,"node_type_id":"Category","display_in_list":true}}
[navigation_id] =>
[effective_navigation_id] =>
)
[_relations:protected] => Array
(
)
[_previousValues:protected] => Array
(
)
[_options:protected] => Array
(
)
[_deleted:protected] =>
[_readOnly:protected] =>
[_writePending:protected] =>
[_writeRunning:protected] =>
[_errors:protected] => Array
(
)
[_whenSaveable:protected] => Array
(
)
[_cascadeSave:protected] => Array
(
)
[_behaviors:protected] =>
)
)
[_previousValues:protected] => Array
(
)
[_options:protected] => Array
(
)
[_deleted:protected] =>
[_readOnly:protected] =>
[_writePending:protected] =>
[_writeRunning:protected] =>
[_errors:protected] => Array
(
)
[_whenSaveable:protected] => Array
(
)
[_cascadeSave:protected] => Array
(
)
[_behaviors:protected] =>
)
)
[_previousValues:protected] => Array
(
)
[_options:protected] => Array
(
)
[_deleted:protected] =>
[_readOnly:protected] =>
[_writePending:protected] =>
[_writeRunning:protected] =>
[_errors:protected] => Array
(
)
[_whenSaveable:protected] => Array
(
)
[_cascadeSave:protected] => Array
(
)
[_behaviors:protected] =>
)
[20074] => ThemeHouse\XPress\XF\Entity\Thread Object
(
[_uniqueEntityId:XF\Mvc\Entity\Entity:private] => 75
[rootClass:protected] => XF\Entity\Thread
[_useReplaceInto:protected] =>
[_newValues:protected] => Array
(
)
[_values:protected] => Array
(
[thread_id] => 20074
[node_id] => 2
[title] => 60 MINUTES - NEWSMAKERS: Commerce Secretary Gina Raimondo on U.S. microchip production, blocking of sales to China, Russia
[reply_count] => 5
[view_count] => 567
[user_id] => 5
[username] => Daniel Nenni
[post_date] => 1713793871
[sticky] => 0
[discussion_state] => visible
[discussion_open] => 1
[discussion_type] => discussion
[first_post_id] => 69487
[first_post_reaction_score] => 0
[first_post_reactions] => []
[last_post_date] => 1713992297
[last_post_id] => 69571
[last_post_user_id] => 36640
[last_post_username] => soAsian
[prefix_id] => 0
[tags] => []
[custom_fields] => []
[vote_score] => 0
[vote_count] => 0
[type_data] => []
)
[_relations:protected] => Array
(
[User] => ThemeHouse\XLink\XF\Entity\User Object
(
[_uniqueEntityId:XF\Mvc\Entity\Entity:private] => 60
[rootClass:protected] => XF\Entity\User
[_useReplaceInto:protected] =>
[_newValues:protected] => Array
(
)
[_values:protected] => Array
(
[user_id] => 5
[username] => Daniel Nenni
[username_date] => 0
[username_date_visible] => 0
[email] => dnenni@semiwiki.com
[custom_title] => Admin
[language_id] => 1
[style_id] => 0
[timezone] => America/Los_Angeles
[visible] => 1
[activity_visible] => 1
[user_group_id] => 3
[secondary_group_ids] => 4,5,132
[display_style_group_id] => 3
[permission_combination_id] => 88
[message_count] => 11330
[question_solution_count] => 0
[conversations_unread] => 1
[register_date] => 1280720820
[last_activity] => 1714013314
[last_summary_email_date] => 1605968657
[trophy_points] => 113
[alerts_unviewed] => 25
[alerts_unread] => 25
[avatar_date] => 1663211649
[avatar_width] => 110
[avatar_height] => 107
[avatar_highdpi] => 0
[gravatar] =>
[user_state] => valid
[security_lock] =>
[is_moderator] => 1
[is_admin] => 1
[is_banned] => 0
[reaction_score] => 3387
[warning_points] => 0
[is_staff] => 1
[secret_key] => 0HwyUVVHCwJotUUVEpvqAclfYJdGNPpw
[privacy_policy_accepted] => 0
[terms_accepted] => 0
[vote_score] => 0
)
[_relations:protected] => Array
(
)
[_previousValues:protected] => Array
(
)
[_options:protected] => Array
(
)
[_deleted:protected] =>
[_readOnly:protected] =>
[_writePending:protected] =>
[_writeRunning:protected] =>
[_errors:protected] => Array
(
)
[_whenSaveable:protected] => Array
(
)
[_cascadeSave:protected] => Array
(
)
[_behaviors:protected] =>
)
[Forum] => XF\Entity\Forum Object
(
[_uniqueEntityId:XF\Mvc\Entity\Entity:private] => 50
[rootClass:protected] => XF\Entity\Forum
[_useReplaceInto:protected] =>
[_newValues:protected] => Array
(
)
[_values:protected] => Array
(
[node_id] => 2
[discussion_count] => 5728
[message_count] => 35429
[last_post_id] => 69608
[last_post_date] => 1714021137
[last_post_user_id] => 38642
[last_post_username] => VCT
[last_thread_id] => 20062
[last_thread_title] => Timing for TSMC Wafer Orders
[last_thread_prefix_id] => 0
[moderate_threads] => 0
[moderate_replies] => 0
[allow_posting] => 1
[count_messages] => 1
[find_new] => 1
[allow_index] => allow
[index_criteria] =>
[field_cache] => []
[prefix_cache] => []
[prompt_cache] => []
[default_prefix_id] => 0
[default_sort_order] => last_post_date
[default_sort_direction] => desc
[list_date_limit_days] => 0
[require_prefix] => 0
[allowed_watch_notifications] => all
[min_tags] => 0
[forum_type_id] => discussion
[type_config] => {"allowed_thread_types":["poll"]}
)
[_relations:protected] => Array
(
[Node] => XF\Entity\Node Object
(
[_uniqueEntityId:XF\Mvc\Entity\Entity:private] => 49
[rootClass:protected] => XF\Entity\Node
[_useReplaceInto:protected] =>
[_newValues:protected] => Array
(
)
[_values:protected] => Array
(
[node_id] => 2
[title] => SemiWiki Main Forum ( Ask the Experts! )
[description] => Post your questions to the experts here!
[node_name] =>
[node_type_id] => Forum
[parent_node_id] => 1
[display_order] => 1
[display_in_list] => 1
[lft] => 2
[rgt] => 3
[depth] => 1
[style_id] => 0
[effective_style_id] => 0
[breadcrumb_data] => {"1":{"node_id":1,"title":"Main Category","depth":0,"lft":1,"node_name":null,"node_type_id":"Category","display_in_list":true}}
[navigation_id] =>
[effective_navigation_id] =>
)
[_relations:protected] => Array
(
)
[_previousValues:protected] => Array
(
)
[_options:protected] => Array
(
)
[_deleted:protected] =>
[_readOnly:protected] =>
[_writePending:protected] =>
[_writeRunning:protected] =>
[_errors:protected] => Array
(
)
[_whenSaveable:protected] => Array
(
)
[_cascadeSave:protected] => Array
(
)
[_behaviors:protected] =>
)
)
[_previousValues:protected] => Array
(
)
[_options:protected] => Array
(
)
[_deleted:protected] =>
[_readOnly:protected] =>
[_writePending:protected] =>
[_writeRunning:protected] =>
[_errors:protected] => Array
(
)
[_whenSaveable:protected] => Array
(
)
[_cascadeSave:protected] => Array
(
)
[_behaviors:protected] =>
)
)
[_previousValues:protected] => Array
(
)
[_options:protected] => Array
(
)
[_deleted:protected] =>
[_readOnly:protected] =>
[_writePending:protected] =>
[_writeRunning:protected] =>
[_errors:protected] => Array
(
)
[_whenSaveable:protected] => Array
(
)
[_cascadeSave:protected] => Array
(
)
[_behaviors:protected] =>
)
[20100] => ThemeHouse\XPress\XF\Entity\Thread Object
(
[_uniqueEntityId:XF\Mvc\Entity\Entity:private] => 79
[rootClass:protected] => XF\Entity\Thread
[_useReplaceInto:protected] =>
[_newValues:protected] => Array
(
)
[_values:protected] => Array
(
[thread_id] => 20100
[node_id] => 2
[title] => TSMC Celebrates 30th North America Technology Symposium with Innovations Powering AI with Silicon Leadership
[reply_count] => 0
[view_count] => 73
[user_id] => 36490
[username] => fansink
[post_date] => 1713991349
[sticky] => 0
[discussion_state] => visible
[discussion_open] => 1
[discussion_type] => discussion
[first_post_id] => 69567
[first_post_reaction_score] => 0
[first_post_reactions] => []
[last_post_date] => 1713991349
[last_post_id] => 69567
[last_post_user_id] => 36490
[last_post_username] => fansink
[prefix_id] => 0
[tags] => []
[custom_fields] => []
[vote_score] => 0
[vote_count] => 0
[type_data] => []
)
[_relations:protected] => Array
(
[User] => ThemeHouse\XLink\XF\Entity\User Object
(
[_uniqueEntityId:XF\Mvc\Entity\Entity:private] => 48
[rootClass:protected] => XF\Entity\User
[_useReplaceInto:protected] =>
[_newValues:protected] => Array
(
)
[_values:protected] => Array
(
[user_id] => 36490
[username] => fansink
[username_date] => 1633797241
[username_date_visible] => 1633786579
[email] => dt@novelconceptsinc.com
[custom_title] =>
[language_id] => 1
[style_id] => 0
[timezone] => America/Los_Angeles
[visible] => 1
[activity_visible] => 1
[user_group_id] => 2
[secondary_group_ids] =>
[display_style_group_id] => 2
[permission_combination_id] => 8
[message_count] => 183
[question_solution_count] => 0
[conversations_unread] => 0
[register_date] => 1607181097
[last_activity] => 1714014034
[last_summary_email_date] =>
[trophy_points] => 28
[alerts_unviewed] => 3
[alerts_unread] => 4
[avatar_date] => 1633786654
[avatar_width] => 384
[avatar_height] => 384
[avatar_highdpi] => 1
[gravatar] =>
[user_state] => valid
[security_lock] =>
[is_moderator] => 0
[is_admin] => 0
[is_banned] => 0
[reaction_score] => 76
[warning_points] => 0
[is_staff] => 0
[secret_key] => JnrZQ1Uify4Q71rQ2GE1O9d7OVlT2ojg
[privacy_policy_accepted] => 1607181097
[terms_accepted] => 1607181097
[vote_score] => 0
)
[_relations:protected] => Array
(
)
[_previousValues:protected] => Array
(
)
[_options:protected] => Array
(
)
[_deleted:protected] =>
[_readOnly:protected] =>
[_writePending:protected] =>
[_writeRunning:protected] =>
[_errors:protected] => Array
(
)
[_whenSaveable:protected] => Array
(
)
[_cascadeSave:protected] => Array
(
)
[_behaviors:protected] =>
)
[Forum] => XF\Entity\Forum Object
(
[_uniqueEntityId:XF\Mvc\Entity\Entity:private] => 50
[rootClass:protected] => XF\Entity\Forum
[_useReplaceInto:protected] =>
[_newValues:protected] => Array
(
)
[_values:protected] => Array
(
[node_id] => 2
[discussion_count] => 5728
[message_count] => 35429
[last_post_id] => 69608
[last_post_date] => 1714021137
[last_post_user_id] => 38642
[last_post_username] => VCT
[last_thread_id] => 20062
[last_thread_title] => Timing for TSMC Wafer Orders
[last_thread_prefix_id] => 0
[moderate_threads] => 0
[moderate_replies] => 0
[allow_posting] => 1
[count_messages] => 1
[find_new] => 1
[allow_index] => allow
[index_criteria] =>
[field_cache] => []
[prefix_cache] => []
[prompt_cache] => []
[default_prefix_id] => 0
[default_sort_order] => last_post_date
[default_sort_direction] => desc
[list_date_limit_days] => 0
[require_prefix] => 0
[allowed_watch_notifications] => all
[min_tags] => 0
[forum_type_id] => discussion
[type_config] => {"allowed_thread_types":["poll"]}
)
[_relations:protected] => Array
(
[Node] => XF\Entity\Node Object
(
[_uniqueEntityId:XF\Mvc\Entity\Entity:private] => 49
[rootClass:protected] => XF\Entity\Node
[_useReplaceInto:protected] =>
[_newValues:protected] => Array
(
)
[_values:protected] => Array
(
[node_id] => 2
[title] => SemiWiki Main Forum ( Ask the Experts! )
[description] => Post your questions to the experts here!
[node_name] =>
[node_type_id] => Forum
[parent_node_id] => 1
[display_order] => 1
[display_in_list] => 1
[lft] => 2
[rgt] => 3
[depth] => 1
[style_id] => 0
[effective_style_id] => 0
[breadcrumb_data] => {"1":{"node_id":1,"title":"Main Category","depth":0,"lft":1,"node_name":null,"node_type_id":"Category","display_in_list":true}}
[navigation_id] =>
[effective_navigation_id] =>
)
[_relations:protected] => Array
(
)
[_previousValues:protected] => Array
(
)
[_options:protected] => Array
(
)
[_deleted:protected] =>
[_readOnly:protected] =>
[_writePending:protected] =>
[_writeRunning:protected] =>
[_errors:protected] => Array
(
)
[_whenSaveable:protected] => Array
(
)
[_cascadeSave:protected] => Array
(
)
[_behaviors:protected] =>
)
)
[_previousValues:protected] => Array
(
)
[_options:protected] => Array
(
)
[_deleted:protected] =>
[_readOnly:protected] =>
[_writePending:protected] =>
[_writeRunning:protected] =>
[_errors:protected] => Array
(
)
[_whenSaveable:protected] => Array
(
)
[_cascadeSave:protected] => Array
(
)
[_behaviors:protected] =>
)
)
[_previousValues:protected] => Array
(
)
[_options:protected] => Array
(
)
[_deleted:protected] =>
[_readOnly:protected] =>
[_writePending:protected] =>
[_writeRunning:protected] =>
[_errors:protected] => Array
(
)
[_whenSaveable:protected] => Array
(
)
[_cascadeSave:protected] => Array
(
)
[_behaviors:protected] =>
)
[20098] => ThemeHouse\XPress\XF\Entity\Thread Object
(
[_uniqueEntityId:XF\Mvc\Entity\Entity:private] => 83
[rootClass:protected] => XF\Entity\Thread
[_useReplaceInto:protected] =>
[_newValues:protected] => Array
(
)
[_values:protected] => Array
(
[thread_id] => 20098
[node_id] => 2
[title] => UMC Reports First Quarter 2024 Results
[reply_count] => 1
[view_count] => 174
[user_id] => 5
[username] => Daniel Nenni
[post_date] => 1713964863
[sticky] => 0
[discussion_state] => visible
[discussion_open] => 1
[discussion_type] => discussion
[first_post_id] => 69545
[first_post_reaction_score] => 0
[first_post_reactions] => []
[last_post_date] => 1713987519
[last_post_id] => 69564
[last_post_user_id] => 5509
[last_post_username] => milesgehm
[prefix_id] => 0
[tags] => []
[custom_fields] => []
[vote_score] => 0
[vote_count] => 0
[type_data] => []
)
[_relations:protected] => Array
(
[User] => ThemeHouse\XLink\XF\Entity\User Object
(
[_uniqueEntityId:XF\Mvc\Entity\Entity:private] => 60
[rootClass:protected] => XF\Entity\User
[_useReplaceInto:protected] =>
[_newValues:protected] => Array
(
)
[_values:protected] => Array
(
[user_id] => 5
[username] => Daniel Nenni
[username_date] => 0
[username_date_visible] => 0
[email] => dnenni@semiwiki.com
[custom_title] => Admin
[language_id] => 1
[style_id] => 0
[timezone] => America/Los_Angeles
[visible] => 1
[activity_visible] => 1
[user_group_id] => 3
[secondary_group_ids] => 4,5,132
[display_style_group_id] => 3
[permission_combination_id] => 88
[message_count] => 11330
[question_solution_count] => 0
[conversations_unread] => 1
[register_date] => 1280720820
[last_activity] => 1714013314
[last_summary_email_date] => 1605968657
[trophy_points] => 113
[alerts_unviewed] => 25
[alerts_unread] => 25
[avatar_date] => 1663211649
[avatar_width] => 110
[avatar_height] => 107
[avatar_highdpi] => 0
[gravatar] =>
[user_state] => valid
[security_lock] =>
[is_moderator] => 1
[is_admin] => 1
[is_banned] => 0
[reaction_score] => 3387
[warning_points] => 0
[is_staff] => 1
[secret_key] => 0HwyUVVHCwJotUUVEpvqAclfYJdGNPpw
[privacy_policy_accepted] => 0
[terms_accepted] => 0
[vote_score] => 0
)
[_relations:protected] => Array
(
)
[_previousValues:protected] => Array
(
)
[_options:protected] => Array
(
)
[_deleted:protected] =>
[_readOnly:protected] =>
[_writePending:protected] =>
[_writeRunning:protected] =>
[_errors:protected] => Array
(
)
[_whenSaveable:protected] => Array
(
)
[_cascadeSave:protected] => Array
(
)
[_behaviors:protected] =>
)
[Forum] => XF\Entity\Forum Object
(
[_uniqueEntityId:XF\Mvc\Entity\Entity:private] => 50
[rootClass:protected] => XF\Entity\Forum
[_useReplaceInto:protected] =>
[_newValues:protected] => Array
(
)
[_values:protected] => Array
(
[node_id] => 2
[discussion_count] => 5728
[message_count] => 35429
[last_post_id] => 69608
[last_post_date] => 1714021137
[last_post_user_id] => 38642
[last_post_username] => VCT
[last_thread_id] => 20062
[last_thread_title] => Timing for TSMC Wafer Orders
[last_thread_prefix_id] => 0
[moderate_threads] => 0
[moderate_replies] => 0
[allow_posting] => 1
[count_messages] => 1
[find_new] => 1
[allow_index] => allow
[index_criteria] =>
[field_cache] => []
[prefix_cache] => []
[prompt_cache] => []
[default_prefix_id] => 0
[default_sort_order] => last_post_date
[default_sort_direction] => desc
[list_date_limit_days] => 0
[require_prefix] => 0
[allowed_watch_notifications] => all
[min_tags] => 0
[forum_type_id] => discussion
[type_config] => {"allowed_thread_types":["poll"]}
)
[_relations:protected] => Array
(
[Node] => XF\Entity\Node Object
(
[_uniqueEntityId:XF\Mvc\Entity\Entity:private] => 49
[rootClass:protected] => XF\Entity\Node
[_useReplaceInto:protected] =>
[_newValues:protected] => Array
(
)
[_values:protected] => Array
(
[node_id] => 2
[title] => SemiWiki Main Forum ( Ask the Experts! )
[description] => Post your questions to the experts here!
[node_name] =>
[node_type_id] => Forum
[parent_node_id] => 1
[display_order] => 1
[display_in_list] => 1
[lft] => 2
[rgt] => 3
[depth] => 1
[style_id] => 0
[effective_style_id] => 0
[breadcrumb_data] => {"1":{"node_id":1,"title":"Main Category","depth":0,"lft":1,"node_name":null,"node_type_id":"Category","display_in_list":true}}
[navigation_id] =>
[effective_navigation_id] =>
)
[_relations:protected] => Array
(
)
[_previousValues:protected] => Array
(
)
[_options:protected] => Array
(
)
[_deleted:protected] =>
[_readOnly:protected] =>
[_writePending:protected] =>
[_writeRunning:protected] =>
[_errors:protected] => Array
(
)
[_whenSaveable:protected] => Array
(
)
[_cascadeSave:protected] => Array
(
)
[_behaviors:protected] =>
)
)
[_previousValues:protected] => Array
(
)
[_options:protected] => Array
(
)
[_deleted:protected] =>
[_readOnly:protected] =>
[_writePending:protected] =>
[_writeRunning:protected] =>
[_errors:protected] => Array
(
)
[_whenSaveable:protected] => Array
(
)
[_cascadeSave:protected] => Array
(
)
[_behaviors:protected] =>
)
)
[_previousValues:protected] => Array
(
)
[_options:protected] => Array
(
)
[_deleted:protected] =>
[_readOnly:protected] =>
[_writePending:protected] =>
[_writeRunning:protected] =>
[_errors:protected] => Array
(
)
[_whenSaveable:protected] => Array
(
)
[_cascadeSave:protected] => Array
(
)
[_behaviors:protected] =>
)
[20097] => ThemeHouse\XPress\XF\Entity\Thread Object
(
[_uniqueEntityId:XF\Mvc\Entity\Entity:private] => 87
[rootClass:protected] => XF\Entity\Thread
[_useReplaceInto:protected] =>
[_newValues:protected] => Array
(
)
[_values:protected] => Array
(
[thread_id] => 20097
[node_id] => 2
[title] => Power Challenges at Nevada Data Center campus
[reply_count] => 4
[view_count] => 163
[user_id] => 10499
[username] => Arthur Hanson
[post_date] => 1713959398
[sticky] => 0
[discussion_state] => visible
[discussion_open] => 1
[discussion_type] => discussion
[first_post_id] => 69542
[first_post_reaction_score] => 0
[first_post_reactions] => []
[last_post_date] => 1713987387
[last_post_id] => 69563
[last_post_user_id] => 5509
[last_post_username] => milesgehm
[prefix_id] => 0
[tags] => []
[custom_fields] => []
[vote_score] => 0
[vote_count] => 0
[type_data] => []
)
[_relations:protected] => Array
(
[User] => ThemeHouse\XLink\XF\Entity\User Object
(
[_uniqueEntityId:XF\Mvc\Entity\Entity:private] => 84
[rootClass:protected] => XF\Entity\User
[_useReplaceInto:protected] =>
[_newValues:protected] => Array
(
)
[_values:protected] => Array
(
[user_id] => 10499
[username] => Arthur Hanson
[username_date] => 0
[username_date_visible] => 0
[email] => a-j-hanson@att.net
[custom_title] =>
[language_id] => 1
[style_id] => 1
[timezone] => America/Los_Angeles
[visible] => 1
[activity_visible] => 1
[user_group_id] => 2
[secondary_group_ids] =>
[display_style_group_id] => 2
[permission_combination_id] => 8
[message_count] => 2966
[question_solution_count] => 0
[conversations_unread] => 0
[register_date] => 1366028460
[last_activity] => 1713983460
[last_summary_email_date] => 1606051785
[trophy_points] => 83
[alerts_unviewed] => 5
[alerts_unread] => 5
[avatar_date] => 0
[avatar_width] => 0
[avatar_height] => 0
[avatar_highdpi] => 0
[gravatar] =>
[user_state] => valid
[security_lock] =>
[is_moderator] => 0
[is_admin] => 0
[is_banned] => 0
[reaction_score] => 341
[warning_points] => 0
[is_staff] => 0
[secret_key] => ta_8_Pj20m6PDO6RnrGK-VnSP_vyhP_m
[privacy_policy_accepted] => 0
[terms_accepted] => 0
[vote_score] => 0
)
[_relations:protected] => Array
(
)
[_previousValues:protected] => Array
(
)
[_options:protected] => Array
(
)
[_deleted:protected] =>
[_readOnly:protected] =>
[_writePending:protected] =>
[_writeRunning:protected] =>
[_errors:protected] => Array
(
)
[_whenSaveable:protected] => Array
(
)
[_cascadeSave:protected] => Array
(
)
[_behaviors:protected] =>
)
[Forum] => XF\Entity\Forum Object
(
[_uniqueEntityId:XF\Mvc\Entity\Entity:private] => 50
[rootClass:protected] => XF\Entity\Forum
[_useReplaceInto:protected] =>
[_newValues:protected] => Array
(
)
[_values:protected] => Array
(
[node_id] => 2
[discussion_count] => 5728
[message_count] => 35429
[last_post_id] => 69608
[last_post_date] => 1714021137
[last_post_user_id] => 38642
[last_post_username] => VCT
[last_thread_id] => 20062
[last_thread_title] => Timing for TSMC Wafer Orders
[last_thread_prefix_id] => 0
[moderate_threads] => 0
[moderate_replies] => 0
[allow_posting] => 1
[count_messages] => 1
[find_new] => 1
[allow_index] => allow
[index_criteria] =>
[field_cache] => []
[prefix_cache] => []
[prompt_cache] => []
[default_prefix_id] => 0
[default_sort_order] => last_post_date
[default_sort_direction] => desc
[list_date_limit_days] => 0
[require_prefix] => 0
[allowed_watch_notifications] => all
[min_tags] => 0
[forum_type_id] => discussion
[type_config] => {"allowed_thread_types":["poll"]}
)
[_relations:protected] => Array
(
[Node] => XF\Entity\Node Object
(
[_uniqueEntityId:XF\Mvc\Entity\Entity:private] => 49
[rootClass:protected] => XF\Entity\Node
[_useReplaceInto:protected] =>
[_newValues:protected] => Array
(
)
[_values:protected] => Array
(
[node_id] => 2
[title] => SemiWiki Main Forum ( Ask the Experts! )
[description] => Post your questions to the experts here!
[node_name] =>
[node_type_id] => Forum
[parent_node_id] => 1
[display_order] => 1
[display_in_list] => 1
[lft] => 2
[rgt] => 3
[depth] => 1
[style_id] => 0
[effective_style_id] => 0
[breadcrumb_data] => {"1":{"node_id":1,"title":"Main Category","depth":0,"lft":1,"node_name":null,"node_type_id":"Category","display_in_list":true}}
[navigation_id] =>
[effective_navigation_id] =>
)
[_relations:protected] => Array
(
)
[_previousValues:protected] => Array
(
)
[_options:protected] => Array
(
)
[_deleted:protected] =>
[_readOnly:protected] =>
[_writePending:protected] =>
[_writeRunning:protected] =>
[_errors:protected] => Array
(
)
[_whenSaveable:protected] => Array
(
)
[_cascadeSave:protected] => Array
(
)
[_behaviors:protected] =>
)
)
[_previousValues:protected] => Array
(
)
[_options:protected] => Array
(
)
[_deleted:protected] =>
[_readOnly:protected] =>
[_writePending:protected] =>
[_writeRunning:protected] =>
[_errors:protected] => Array
(
)
[_whenSaveable:protected] => Array
(
)
[_cascadeSave:protected] => Array
(
)
[_behaviors:protected] =>
)
)
[_previousValues:protected] => Array
(
)
[_options:protected] => Array
(
)
[_deleted:protected] =>
[_readOnly:protected] =>
[_writePending:protected] =>
[_writeRunning:protected] =>
[_errors:protected] => Array
(
)
[_whenSaveable:protected] => Array
(
)
[_cascadeSave:protected] => Array
(
)
[_behaviors:protected] =>
)
[20099] => ThemeHouse\XPress\XF\Entity\Thread Object
(
[_uniqueEntityId:XF\Mvc\Entity\Entity:private] => 91
[rootClass:protected] => XF\Entity\Thread
[_useReplaceInto:protected] =>
[_newValues:protected] => Array
(
)
[_values:protected] => Array
(
[thread_id] => 20099
[node_id] => 2
[title] => AI and Robotics set to change everything.
[reply_count] => 0
[view_count] => 73
[user_id] => 10499
[username] => Arthur Hanson
[post_date] => 1713983354
[sticky] => 0
[discussion_state] => visible
[discussion_open] => 1
[discussion_type] => discussion
[first_post_id] => 69562
[first_post_reaction_score] => 0
[first_post_reactions] => []
[last_post_date] => 1713983354
[last_post_id] => 69562
[last_post_user_id] => 10499
[last_post_username] => Arthur Hanson
[prefix_id] => 0
[tags] => []
[custom_fields] => []
[vote_score] => 0
[vote_count] => 0
[type_data] => []
)
[_relations:protected] => Array
(
[User] => ThemeHouse\XLink\XF\Entity\User Object
(
[_uniqueEntityId:XF\Mvc\Entity\Entity:private] => 84
[rootClass:protected] => XF\Entity\User
[_useReplaceInto:protected] =>
[_newValues:protected] => Array
(
)
[_values:protected] => Array
(
[user_id] => 10499
[username] => Arthur Hanson
[username_date] => 0
[username_date_visible] => 0
[email] => a-j-hanson@att.net
[custom_title] =>
[language_id] => 1
[style_id] => 1
[timezone] => America/Los_Angeles
[visible] => 1
[activity_visible] => 1
[user_group_id] => 2
[secondary_group_ids] =>
[display_style_group_id] => 2
[permission_combination_id] => 8
[message_count] => 2966
[question_solution_count] => 0
[conversations_unread] => 0
[register_date] => 1366028460
[last_activity] => 1713983460
[last_summary_email_date] => 1606051785
[trophy_points] => 83
[alerts_unviewed] => 5
[alerts_unread] => 5
[avatar_date] => 0
[avatar_width] => 0
[avatar_height] => 0
[avatar_highdpi] => 0
[gravatar] =>
[user_state] => valid
[security_lock] =>
[is_moderator] => 0
[is_admin] => 0
[is_banned] => 0
[reaction_score] => 341
[warning_points] => 0
[is_staff] => 0
[secret_key] => ta_8_Pj20m6PDO6RnrGK-VnSP_vyhP_m
[privacy_policy_accepted] => 0
[terms_accepted] => 0
[vote_score] => 0
)
[_relations:protected] => Array
(
)
[_previousValues:protected] => Array
(
)
[_options:protected] => Array
(
)
[_deleted:protected] =>
[_readOnly:protected] =>
[_writePending:protected] =>
[_writeRunning:protected] =>
[_errors:protected] => Array
(
)
[_whenSaveable:protected] => Array
(
)
[_cascadeSave:protected] => Array
(
)
[_behaviors:protected] =>
)
[Forum] => XF\Entity\Forum Object
(
[_uniqueEntityId:XF\Mvc\Entity\Entity:private] => 50
[rootClass:protected] => XF\Entity\Forum
[_useReplaceInto:protected] =>
[_newValues:protected] => Array
(
)
[_values:protected] => Array
(
[node_id] => 2
[discussion_count] => 5728
[message_count] => 35429
[last_post_id] => 69608
[last_post_date] => 1714021137
[last_post_user_id] => 38642
[last_post_username] => VCT
[last_thread_id] => 20062
[last_thread_title] => Timing for TSMC Wafer Orders
[last_thread_prefix_id] => 0
[moderate_threads] => 0
[moderate_replies] => 0
[allow_posting] => 1
[count_messages] => 1
[find_new] => 1
[allow_index] => allow
[index_criteria] =>
[field_cache] => []
[prefix_cache] => []
[prompt_cache] => []
[default_prefix_id] => 0
[default_sort_order] => last_post_date
[default_sort_direction] => desc
[list_date_limit_days] => 0
[require_prefix] => 0
[allowed_watch_notifications] => all
[min_tags] => 0
[forum_type_id] => discussion
[type_config] => {"allowed_thread_types":["poll"]}
)
[_relations:protected] => Array
(
[Node] => XF\Entity\Node Object
(
[_uniqueEntityId:XF\Mvc\Entity\Entity:private] => 49
[rootClass:protected] => XF\Entity\Node
[_useReplaceInto:protected] =>
[_newValues:protected] => Array
(
)
[_values:protected] => Array
(
[node_id] => 2
[title] => SemiWiki Main Forum ( Ask the Experts! )
[description] => Post your questions to the experts here!
[node_name] =>
[node_type_id] => Forum
[parent_node_id] => 1
[display_order] => 1
[display_in_list] => 1
[lft] => 2
[rgt] => 3
[depth] => 1
[style_id] => 0
[effective_style_id] => 0
[breadcrumb_data] => {"1":{"node_id":1,"title":"Main Category","depth":0,"lft":1,"node_name":null,"node_type_id":"Category","display_in_list":true}}
[navigation_id] =>
[effective_navigation_id] =>
)
[_relations:protected] => Array
(
)
[_previousValues:protected] => Array
(
)
[_options:protected] => Array
(
)
[_deleted:protected] =>
[_readOnly:protected] =>
[_writePending:protected] =>
[_writeRunning:protected] =>
[_errors:protected] => Array
(
)
[_whenSaveable:protected] => Array
(
)
[_cascadeSave:protected] => Array
(
)
[_behaviors:protected] =>
)
)
[_previousValues:protected] => Array
(
)
[_options:protected] => Array
(
)
[_deleted:protected] =>
[_readOnly:protected] =>
[_writePending:protected] =>
[_writeRunning:protected] =>
[_errors:protected] => Array
(
)
[_whenSaveable:protected] => Array
(
)
[_cascadeSave:protected] => Array
(
)
[_behaviors:protected] =>
)
)
[_previousValues:protected] => Array
(
)
[_options:protected] => Array
(
)
[_deleted:protected] =>
[_readOnly:protected] =>
[_writePending:protected] =>
[_writeRunning:protected] =>
[_errors:protected] => Array
(
)
[_whenSaveable:protected] => Array
(
)
[_cascadeSave:protected] => Array
(
)
[_behaviors:protected] =>
)
[20096] => ThemeHouse\XPress\XF\Entity\Thread Object
(
[_uniqueEntityId:XF\Mvc\Entity\Entity:private] => 95
[rootClass:protected] => XF\Entity\Thread
[_useReplaceInto:protected] =>
[_newValues:protected] => Array
(
)
[_values:protected] => Array
(
[thread_id] => 20096
[node_id] => 2
[title] => Rudolph Stepper for Back-End Packaging and Testing
[reply_count] => 0
[view_count] => 120
[user_id] => 20231
[username] => Barnsley
[post_date] => 1713944606
[sticky] => 0
[discussion_state] => visible
[discussion_open] => 1
[discussion_type] => discussion
[first_post_id] => 69540
[first_post_reaction_score] => 0
[first_post_reactions] => []
[last_post_date] => 1713944606
[last_post_id] => 69540
[last_post_user_id] => 20231
[last_post_username] => Barnsley
[prefix_id] => 0
[tags] => []
[custom_fields] => []
[vote_score] => 0
[vote_count] => 0
[type_data] => []
)
[_relations:protected] => Array
(
[User] => ThemeHouse\XLink\XF\Entity\User Object
(
[_uniqueEntityId:XF\Mvc\Entity\Entity:private] => 92
[rootClass:protected] => XF\Entity\User
[_useReplaceInto:protected] =>
[_newValues:protected] => Array
(
)
[_values:protected] => Array
(
[user_id] => 20231
[username] => Barnsley
[username_date] => 0
[username_date_visible] => 0
[email] => apickering72@gmail.com
[custom_title] =>
[language_id] => 1
[style_id] => 0
[timezone] => Asia/Irkutsk
[visible] => 1
[activity_visible] => 1
[user_group_id] => 2
[secondary_group_ids] =>
[display_style_group_id] => 2
[permission_combination_id] => 8
[message_count] => 404
[question_solution_count] => 0
[conversations_unread] => 0
[register_date] => 1429440429
[last_activity] => 1714012460
[last_summary_email_date] => 1653315673
[trophy_points] => 43
[alerts_unviewed] => 8
[alerts_unread] => 8
[avatar_date] => 0
[avatar_width] => 0
[avatar_height] => 0
[avatar_highdpi] => 0
[gravatar] =>
[user_state] => valid
[security_lock] =>
[is_moderator] => 0
[is_admin] => 0
[is_banned] => 0
[reaction_score] => 164
[warning_points] => 0
[is_staff] => 0
[secret_key] => iAnkz9GTDfivRmH1BOp6OTrgESJR57G8
[privacy_policy_accepted] => 0
[terms_accepted] => 0
[vote_score] => 0
)
[_relations:protected] => Array
(
)
[_previousValues:protected] => Array
(
)
[_options:protected] => Array
(
)
[_deleted:protected] =>
[_readOnly:protected] =>
[_writePending:protected] =>
[_writeRunning:protected] =>
[_errors:protected] => Array
(
)
[_whenSaveable:protected] => Array
(
)
[_cascadeSave:protected] => Array
(
)
[_behaviors:protected] =>
)
[Forum] => XF\Entity\Forum Object
(
[_uniqueEntityId:XF\Mvc\Entity\Entity:private] => 50
[rootClass:protected] => XF\Entity\Forum
[_useReplaceInto:protected] =>
[_newValues:protected] => Array
(
)
[_values:protected] => Array
(
[node_id] => 2
[discussion_count] => 5728
[message_count] => 35429
[last_post_id] => 69608
[last_post_date] => 1714021137
[last_post_user_id] => 38642
[last_post_username] => VCT
[last_thread_id] => 20062
[last_thread_title] => Timing for TSMC Wafer Orders
[last_thread_prefix_id] => 0
[moderate_threads] => 0
[moderate_replies] => 0
[allow_posting] => 1
[count_messages] => 1
[find_new] => 1
[allow_index] => allow
[index_criteria] =>
[field_cache] => []
[prefix_cache] => []
[prompt_cache] => []
[default_prefix_id] => 0
[default_sort_order] => last_post_date
[default_sort_direction] => desc
[list_date_limit_days] => 0
[require_prefix] => 0
[allowed_watch_notifications] => all
[min_tags] => 0
[forum_type_id] => discussion
[type_config] => {"allowed_thread_types":["poll"]}
)
[_relations:protected] => Array
(
[Node] => XF\Entity\Node Object
(
[_uniqueEntityId:XF\Mvc\Entity\Entity:private] => 49
[rootClass:protected] => XF\Entity\Node
[_useReplaceInto:protected] =>
[_newValues:protected] => Array
(
)
[_values:protected] => Array
(
[node_id] => 2
[title] => SemiWiki Main Forum ( Ask the Experts! )
[description] => Post your questions to the experts here!
[node_name] =>
[node_type_id] => Forum
[parent_node_id] => 1
[display_order] => 1
[display_in_list] => 1
[lft] => 2
[rgt] => 3
[depth] => 1
[style_id] => 0
[effective_style_id] => 0
[breadcrumb_data] => {"1":{"node_id":1,"title":"Main Category","depth":0,"lft":1,"node_name":null,"node_type_id":"Category","display_in_list":true}}
[navigation_id] =>
[effective_navigation_id] =>
)
[_relations:protected] => Array
(
)
[_previousValues:protected] => Array
(
)
[_options:protected] => Array
(
)
[_deleted:protected] =>
[_readOnly:protected] =>
[_writePending:protected] =>
[_writeRunning:protected] =>
[_errors:protected] => Array
(
)
[_whenSaveable:protected] => Array
(
)
[_cascadeSave:protected] => Array
(
)
[_behaviors:protected] =>
)
)
[_previousValues:protected] => Array
(
)
[_options:protected] => Array
(
)
[_deleted:protected] =>
[_readOnly:protected] =>
[_writePending:protected] =>
[_writeRunning:protected] =>
[_errors:protected] => Array
(
)
[_whenSaveable:protected] => Array
(
)
[_cascadeSave:protected] => Array
(
)
[_behaviors:protected] =>
)
)
[_previousValues:protected] => Array
(
)
[_options:protected] => Array
(
)
[_deleted:protected] =>
[_readOnly:protected] =>
[_writePending:protected] =>
[_writeRunning:protected] =>
[_errors:protected] => Array
(
)
[_whenSaveable:protected] => Array
(
)
[_cascadeSave:protected] => Array
(
)
[_behaviors:protected] =>
)
[19688] => ThemeHouse\XPress\XF\Entity\Thread Object
(
[_uniqueEntityId:XF\Mvc\Entity\Entity:private] => 99
[rootClass:protected] => XF\Entity\Thread
[_useReplaceInto:protected] =>
[_newValues:protected] => Array
(
)
[_values:protected] => Array
(
[thread_id] => 19688
[node_id] => 2
[title] => Is this software advance significant?
[reply_count] => 4
[view_count] => 759
[user_id] => 10499
[username] => Arthur Hanson
[post_date] => 1708780366
[sticky] => 0
[discussion_state] => visible
[discussion_open] => 1
[discussion_type] => discussion
[first_post_id] => 67806
[first_post_reaction_score] => 1
[first_post_reactions] => {"1":1}
[last_post_date] => 1713917168
[last_post_id] => 69536
[last_post_user_id] => 38697
[last_post_username] => blueone
[prefix_id] => 0
[tags] => []
[custom_fields] => []
[vote_score] => 0
[vote_count] => 0
[type_data] => []
)
[_relations:protected] => Array
(
[User] => ThemeHouse\XLink\XF\Entity\User Object
(
[_uniqueEntityId:XF\Mvc\Entity\Entity:private] => 84
[rootClass:protected] => XF\Entity\User
[_useReplaceInto:protected] =>
[_newValues:protected] => Array
(
)
[_values:protected] => Array
(
[user_id] => 10499
[username] => Arthur Hanson
[username_date] => 0
[username_date_visible] => 0
[email] => a-j-hanson@att.net
[custom_title] =>
[language_id] => 1
[style_id] => 1
[timezone] => America/Los_Angeles
[visible] => 1
[activity_visible] => 1
[user_group_id] => 2
[secondary_group_ids] =>
[display_style_group_id] => 2
[permission_combination_id] => 8
[message_count] => 2966
[question_solution_count] => 0
[conversations_unread] => 0
[register_date] => 1366028460
[last_activity] => 1713983460
[last_summary_email_date] => 1606051785
[trophy_points] => 83
[alerts_unviewed] => 5
[alerts_unread] => 5
[avatar_date] => 0
[avatar_width] => 0
[avatar_height] => 0
[avatar_highdpi] => 0
[gravatar] =>
[user_state] => valid
[security_lock] =>
[is_moderator] => 0
[is_admin] => 0
[is_banned] => 0
[reaction_score] => 341
[warning_points] => 0
[is_staff] => 0
[secret_key] => ta_8_Pj20m6PDO6RnrGK-VnSP_vyhP_m
[privacy_policy_accepted] => 0
[terms_accepted] => 0
[vote_score] => 0
)
[_relations:protected] => Array
(
)
[_previousValues:protected] => Array
(
)
[_options:protected] => Array
(
)
[_deleted:protected] =>
[_readOnly:protected] =>
[_writePending:protected] =>
[_writeRunning:protected] =>
[_errors:protected] => Array
(
)
[_whenSaveable:protected] => Array
(
)
[_cascadeSave:protected] => Array
(
)
[_behaviors:protected] =>
)
[Forum] => XF\Entity\Forum Object
(
[_uniqueEntityId:XF\Mvc\Entity\Entity:private] => 50
[rootClass:protected] => XF\Entity\Forum
[_useReplaceInto:protected] =>
[_newValues:protected] => Array
(
)
[_values:protected] => Array
(
[node_id] => 2
[discussion_count] => 5728
[message_count] => 35429
[last_post_id] => 69608
[last_post_date] => 1714021137
[last_post_user_id] => 38642
[last_post_username] => VCT
[last_thread_id] => 20062
[last_thread_title] => Timing for TSMC Wafer Orders
[last_thread_prefix_id] => 0
[moderate_threads] => 0
[moderate_replies] => 0
[allow_posting] => 1
[count_messages] => 1
[find_new] => 1
[allow_index] => allow
[index_criteria] =>
[field_cache] => []
[prefix_cache] => []
[prompt_cache] => []
[default_prefix_id] => 0
[default_sort_order] => last_post_date
[default_sort_direction] => desc
[list_date_limit_days] => 0
[require_prefix] => 0
[allowed_watch_notifications] => all
[min_tags] => 0
[forum_type_id] => discussion
[type_config] => {"allowed_thread_types":["poll"]}
)
[_relations:protected] => Array
(
[Node] => XF\Entity\Node Object
(
[_uniqueEntityId:XF\Mvc\Entity\Entity:private] => 49
[rootClass:protected] => XF\Entity\Node
[_useReplaceInto:protected] =>
[_newValues:protected] => Array
(
)
[_values:protected] => Array
(
[node_id] => 2
[title] => SemiWiki Main Forum ( Ask the Experts! )
[description] => Post your questions to the experts here!
[node_name] =>
[node_type_id] => Forum
[parent_node_id] => 1
[display_order] => 1
[display_in_list] => 1
[lft] => 2
[rgt] => 3
[depth] => 1
[style_id] => 0
[effective_style_id] => 0
[breadcrumb_data] => {"1":{"node_id":1,"title":"Main Category","depth":0,"lft":1,"node_name":null,"node_type_id":"Category","display_in_list":true}}
[navigation_id] =>
[effective_navigation_id] =>
)
[_relations:protected] => Array
(
)
[_previousValues:protected] => Array
(
)
[_options:protected] => Array
(
)
[_deleted:protected] =>
[_readOnly:protected] =>
[_writePending:protected] =>
[_writeRunning:protected] =>
[_errors:protected] => Array
(
)
[_whenSaveable:protected] => Array
(
)
[_cascadeSave:protected] => Array
(
)
[_behaviors:protected] =>
)
)
[_previousValues:protected] => Array
(
)
[_options:protected] => Array
(
)
[_deleted:protected] =>
[_readOnly:protected] =>
[_writePending:protected] =>
[_writeRunning:protected] =>
[_errors:protected] => Array
(
)
[_whenSaveable:protected] => Array
(
)
[_cascadeSave:protected] => Array
(
)
[_behaviors:protected] =>
)
)
[_previousValues:protected] => Array
(
)
[_options:protected] => Array
(
)
[_deleted:protected] =>
[_readOnly:protected] =>
[_writePending:protected] =>
[_writeRunning:protected] =>
[_errors:protected] => Array
(
)
[_whenSaveable:protected] => Array
(
)
[_cascadeSave:protected] => Array
(
)
[_behaviors:protected] =>
)
[20090] => ThemeHouse\XPress\XF\Entity\Thread Object
(
[_uniqueEntityId:XF\Mvc\Entity\Entity:private] => 103
[rootClass:protected] => XF\Entity\Thread
[_useReplaceInto:protected] =>
[_newValues:protected] => Array
(
)
[_values:protected] => Array
(
[thread_id] => 20090
[node_id] => 2
[title] => There are more than 1160 earthquakes happened in Taiwan in April
[reply_count] => 3
[view_count] => 326
[user_id] => 8322
[username] => hskuo
[post_date] => 1713830018
[sticky] => 0
[discussion_state] => visible
[discussion_open] => 1
[discussion_type] => discussion
[first_post_id] => 69512
[first_post_reaction_score] => 1
[first_post_reactions] => {"1":1}
[last_post_date] => 1713913007
[last_post_id] => 69532
[last_post_user_id] => 8322
[last_post_username] => hskuo
[prefix_id] => 0
[tags] => []
[custom_fields] => []
[vote_score] => 0
[vote_count] => 0
[type_data] => []
)
[_relations:protected] => Array
(
[User] => ThemeHouse\XLink\XF\Entity\User Object
(
[_uniqueEntityId:XF\Mvc\Entity\Entity:private] => 52
[rootClass:protected] => XF\Entity\User
[_useReplaceInto:protected] =>
[_newValues:protected] => Array
(
)
[_values:protected] => Array
(
[user_id] => 8322
[username] => hskuo
[username_date] => 0
[username_date_visible] => 0
[email] => h_s_kuo@yahoo.com.tw
[custom_title] =>
[language_id] => 1
[style_id] => 0
[timezone] => Asia/Singapore
[visible] => 0
[activity_visible] => 0
[user_group_id] => 2
[secondary_group_ids] =>
[display_style_group_id] => 2
[permission_combination_id] => 8
[message_count] => 324
[question_solution_count] => 0
[conversations_unread] => 0
[register_date] => 1353653082
[last_activity] => 1714008077
[last_summary_email_date] =>
[trophy_points] => 63
[alerts_unviewed] => 0
[alerts_unread] => 0
[avatar_date] => 0
[avatar_width] => 0
[avatar_height] => 0
[avatar_highdpi] => 0
[gravatar] =>
[user_state] => valid
[security_lock] =>
[is_moderator] => 0
[is_admin] => 0
[is_banned] => 0
[reaction_score] => 273
[warning_points] => 0
[is_staff] => 0
[secret_key] => dmSCPzj7nJ30LudrsWqXuEY0wtWsm9Z5
[privacy_policy_accepted] => 0
[terms_accepted] => 0
[vote_score] => 0
)
[_relations:protected] => Array
(
)
[_previousValues:protected] => Array
(
)
[_options:protected] => Array
(
)
[_deleted:protected] =>
[_readOnly:protected] =>
[_writePending:protected] =>
[_writeRunning:protected] =>
[_errors:protected] => Array
(
)
[_whenSaveable:protected] => Array
(
)
[_cascadeSave:protected] => Array
(
)
[_behaviors:protected] =>
)
[Forum] => XF\Entity\Forum Object
(
[_uniqueEntityId:XF\Mvc\Entity\Entity:private] => 50
[rootClass:protected] => XF\Entity\Forum
[_useReplaceInto:protected] =>
[_newValues:protected] => Array
(
)
[_values:protected] => Array
(
[node_id] => 2
[discussion_count] => 5728
[message_count] => 35429
[last_post_id] => 69608
[last_post_date] => 1714021137
[last_post_user_id] => 38642
[last_post_username] => VCT
[last_thread_id] => 20062
[last_thread_title] => Timing for TSMC Wafer Orders
[last_thread_prefix_id] => 0
[moderate_threads] => 0
[moderate_replies] => 0
[allow_posting] => 1
[count_messages] => 1
[find_new] => 1
[allow_index] => allow
[index_criteria] =>
[field_cache] => []
[prefix_cache] => []
[prompt_cache] => []
[default_prefix_id] => 0
[default_sort_order] => last_post_date
[default_sort_direction] => desc
[list_date_limit_days] => 0
[require_prefix] => 0
[allowed_watch_notifications] => all
[min_tags] => 0
[forum_type_id] => discussion
[type_config] => {"allowed_thread_types":["poll"]}
)
[_relations:protected] => Array
(
[Node] => XF\Entity\Node Object
(
[_uniqueEntityId:XF\Mvc\Entity\Entity:private] => 49
[rootClass:protected] => XF\Entity\Node
[_useReplaceInto:protected] =>
[_newValues:protected] => Array
(
)
[_values:protected] => Array
(
[node_id] => 2
[title] => SemiWiki Main Forum ( Ask the Experts! )
[description] => Post your questions to the experts here!
[node_name] =>
[node_type_id] => Forum
[parent_node_id] => 1
[display_order] => 1
[display_in_list] => 1
[lft] => 2
[rgt] => 3
[depth] => 1
[style_id] => 0
[effective_style_id] => 0
[breadcrumb_data] => {"1":{"node_id":1,"title":"Main Category","depth":0,"lft":1,"node_name":null,"node_type_id":"Category","display_in_list":true}}
[navigation_id] =>
[effective_navigation_id] =>
)
[_relations:protected] => Array
(
)
[_previousValues:protected] => Array
(
)
[_options:protected] => Array
(
)
[_deleted:protected] =>
[_readOnly:protected] =>
[_writePending:protected] =>
[_writeRunning:protected] =>
[_errors:protected] => Array
(
)
[_whenSaveable:protected] => Array
(
)
[_cascadeSave:protected] => Array
(
)
[_behaviors:protected] =>
)
)
[_previousValues:protected] => Array
(
)
[_options:protected] => Array
(
)
[_deleted:protected] =>
[_readOnly:protected] =>
[_writePending:protected] =>
[_writeRunning:protected] =>
[_errors:protected] => Array
(
)
[_whenSaveable:protected] => Array
(
)
[_cascadeSave:protected] => Array
(
)
[_behaviors:protected] =>
)
)
[_previousValues:protected] => Array
(
)
[_options:protected] => Array
(
)
[_deleted:protected] =>
[_readOnly:protected] =>
[_writePending:protected] =>
[_writeRunning:protected] =>
[_errors:protected] => Array
(
)
[_whenSaveable:protected] => Array
(
)
[_cascadeSave:protected] => Array
(
)
[_behaviors:protected] =>
)
[20092] => ThemeHouse\XPress\XF\Entity\Thread Object
(
[_uniqueEntityId:XF\Mvc\Entity\Entity:private] => 107
[rootClass:protected] => XF\Entity\Thread
[_useReplaceInto:protected] =>
[_newValues:protected] => Array
(
)
[_values:protected] => Array
(
[thread_id] => 20092
[node_id] => 2
[title] => Malaysia to build massive chip design park
[reply_count] => 0
[view_count] => 200
[user_id] => 5
[username] => Daniel Nenni
[post_date] => 1713897242
[sticky] => 0
[discussion_state] => visible
[discussion_open] => 1
[discussion_type] => discussion
[first_post_id] => 69529
[first_post_reaction_score] => 1
[first_post_reactions] => {"1":1}
[last_post_date] => 1713897242
[last_post_id] => 69529
[last_post_user_id] => 5
[last_post_username] => Daniel Nenni
[prefix_id] => 0
[tags] => []
[custom_fields] => []
[vote_score] => 0
[vote_count] => 0
[type_data] => []
)
[_relations:protected] => Array
(
[User] => ThemeHouse\XLink\XF\Entity\User Object
(
[_uniqueEntityId:XF\Mvc\Entity\Entity:private] => 60
[rootClass:protected] => XF\Entity\User
[_useReplaceInto:protected] =>
[_newValues:protected] => Array
(
)
[_values:protected] => Array
(
[user_id] => 5
[username] => Daniel Nenni
[username_date] => 0
[username_date_visible] => 0
[email] => dnenni@semiwiki.com
[custom_title] => Admin
[language_id] => 1
[style_id] => 0
[timezone] => America/Los_Angeles
[visible] => 1
[activity_visible] => 1
[user_group_id] => 3
[secondary_group_ids] => 4,5,132
[display_style_group_id] => 3
[permission_combination_id] => 88
[message_count] => 11330
[question_solution_count] => 0
[conversations_unread] => 1
[register_date] => 1280720820
[last_activity] => 1714013314
[last_summary_email_date] => 1605968657
[trophy_points] => 113
[alerts_unviewed] => 25
[alerts_unread] => 25
[avatar_date] => 1663211649
[avatar_width] => 110
[avatar_height] => 107
[avatar_highdpi] => 0
[gravatar] =>
[user_state] => valid
[security_lock] =>
[is_moderator] => 1
[is_admin] => 1
[is_banned] => 0
[reaction_score] => 3387
[warning_points] => 0
[is_staff] => 1
[secret_key] => 0HwyUVVHCwJotUUVEpvqAclfYJdGNPpw
[privacy_policy_accepted] => 0
[terms_accepted] => 0
[vote_score] => 0
)
[_relations:protected] => Array
(
)
[_previousValues:protected] => Array
(
)
[_options:protected] => Array
(
)
[_deleted:protected] =>
[_readOnly:protected] =>
[_writePending:protected] =>
[_writeRunning:protected] =>
[_errors:protected] => Array
(
)
[_whenSaveable:protected] => Array
(
)
[_cascadeSave:protected] => Array
(
)
[_behaviors:protected] =>
)
[Forum] => XF\Entity\Forum Object
(
[_uniqueEntityId:XF\Mvc\Entity\Entity:private] => 50
[rootClass:protected] => XF\Entity\Forum
[_useReplaceInto:protected] =>
[_newValues:protected] => Array
(
)
[_values:protected] => Array
(
[node_id] => 2
[discussion_count] => 5728
[message_count] => 35429
[last_post_id] => 69608
[last_post_date] => 1714021137
[last_post_user_id] => 38642
[last_post_username] => VCT
[last_thread_id] => 20062
[last_thread_title] => Timing for TSMC Wafer Orders
[last_thread_prefix_id] => 0
[moderate_threads] => 0
[moderate_replies] => 0
[allow_posting] => 1
[count_messages] => 1
[find_new] => 1
[allow_index] => allow
[index_criteria] =>
[field_cache] => []
[prefix_cache] => []
[prompt_cache] => []
[default_prefix_id] => 0
[default_sort_order] => last_post_date
[default_sort_direction] => desc
[list_date_limit_days] => 0
[require_prefix] => 0
[allowed_watch_notifications] => all
[min_tags] => 0
[forum_type_id] => discussion
[type_config] => {"allowed_thread_types":["poll"]}
)
[_relations:protected] => Array
(
[Node] => XF\Entity\Node Object
(
[_uniqueEntityId:XF\Mvc\Entity\Entity:private] => 49
[rootClass:protected] => XF\Entity\Node
[_useReplaceInto:protected] =>
[_newValues:protected] => Array
(
)
[_values:protected] => Array
(
[node_id] => 2
[title] => SemiWiki Main Forum ( Ask the Experts! )
[description] => Post your questions to the experts here!
[node_name] =>
[node_type_id] => Forum
[parent_node_id] => 1
[display_order] => 1
[display_in_list] => 1
[lft] => 2
[rgt] => 3
[depth] => 1
[style_id] => 0
[effective_style_id] => 0
[breadcrumb_data] => {"1":{"node_id":1,"title":"Main Category","depth":0,"lft":1,"node_name":null,"node_type_id":"Category","display_in_list":true}}
[navigation_id] =>
[effective_navigation_id] =>
)
[_relations:protected] => Array
(
)
[_previousValues:protected] => Array
(
)
[_options:protected] => Array
(
)
[_deleted:protected] =>
[_readOnly:protected] =>
[_writePending:protected] =>
[_writeRunning:protected] =>
[_errors:protected] => Array
(
)
[_whenSaveable:protected] => Array
(
)
[_cascadeSave:protected] => Array
(
)
[_behaviors:protected] =>
)
)
[_previousValues:protected] => Array
(
)
[_options:protected] => Array
(
)
[_deleted:protected] =>
[_readOnly:protected] =>
[_writePending:protected] =>
[_writeRunning:protected] =>
[_errors:protected] => Array
(
)
[_whenSaveable:protected] => Array
(
)
[_cascadeSave:protected] => Array
(
)
[_behaviors:protected] =>
)
)
[_previousValues:protected] => Array
(
)
[_options:protected] => Array
(
)
[_deleted:protected] =>
[_readOnly:protected] =>
[_writePending:protected] =>
[_writeRunning:protected] =>
[_errors:protected] => Array
(
)
[_whenSaveable:protected] => Array
(
)
[_cascadeSave:protected] => Array
(
)
[_behaviors:protected] =>
)
[20073] => ThemeHouse\XPress\XF\Entity\Thread Object
(
[_uniqueEntityId:XF\Mvc\Entity\Entity:private] => 111
[rootClass:protected] => XF\Entity\Thread
[_useReplaceInto:protected] =>
[_newValues:protected] => Array
(
)
[_values:protected] => Array
(
[thread_id] => 20073
[node_id] => 2
[title] => Where is all the power going to come from for AI/ML
[reply_count] => 5
[view_count] => 486
[user_id] => 10499
[username] => Arthur Hanson
[post_date] => 1713787280
[sticky] => 0
[discussion_state] => visible
[discussion_open] => 1
[discussion_type] => discussion
[first_post_id] => 69484
[first_post_reaction_score] => 0
[first_post_reactions] => []
[last_post_date] => 1713892653
[last_post_id] => 69526
[last_post_user_id] => 38697
[last_post_username] => blueone
[prefix_id] => 0
[tags] => []
[custom_fields] => []
[vote_score] => 0
[vote_count] => 0
[type_data] => []
)
[_relations:protected] => Array
(
[User] => ThemeHouse\XLink\XF\Entity\User Object
(
[_uniqueEntityId:XF\Mvc\Entity\Entity:private] => 84
[rootClass:protected] => XF\Entity\User
[_useReplaceInto:protected] =>
[_newValues:protected] => Array
(
)
[_values:protected] => Array
(
[user_id] => 10499
[username] => Arthur Hanson
[username_date] => 0
[username_date_visible] => 0
[email] => a-j-hanson@att.net
[custom_title] =>
[language_id] => 1
[style_id] => 1
[timezone] => America/Los_Angeles
[visible] => 1
[activity_visible] => 1
[user_group_id] => 2
[secondary_group_ids] =>
[display_style_group_id] => 2
[permission_combination_id] => 8
[message_count] => 2966
[question_solution_count] => 0
[conversations_unread] => 0
[register_date] => 1366028460
[last_activity] => 1713983460
[last_summary_email_date] => 1606051785
[trophy_points] => 83
[alerts_unviewed] => 5
[alerts_unread] => 5
[avatar_date] => 0
[avatar_width] => 0
[avatar_height] => 0
[avatar_highdpi] => 0
[gravatar] =>
[user_state] => valid
[security_lock] =>
[is_moderator] => 0
[is_admin] => 0
[is_banned] => 0
[reaction_score] => 341
[warning_points] => 0
[is_staff] => 0
[secret_key] => ta_8_Pj20m6PDO6RnrGK-VnSP_vyhP_m
[privacy_policy_accepted] => 0
[terms_accepted] => 0
[vote_score] => 0
)
[_relations:protected] => Array
(
)
[_previousValues:protected] => Array
(
)
[_options:protected] => Array
(
)
[_deleted:protected] =>
[_readOnly:protected] =>
[_writePending:protected] =>
[_writeRunning:protected] =>
[_errors:protected] => Array
(
)
[_whenSaveable:protected] => Array
(
)
[_cascadeSave:protected] => Array
(
)
[_behaviors:protected] =>
)
[Forum] => XF\Entity\Forum Object
(
[_uniqueEntityId:XF\Mvc\Entity\Entity:private] => 50
[rootClass:protected] => XF\Entity\Forum
[_useReplaceInto:protected] =>
[_newValues:protected] => Array
(
)
[_values:protected] => Array
(
[node_id] => 2
[discussion_count] => 5728
[message_count] => 35429
[last_post_id] => 69608
[last_post_date] => 1714021137
[last_post_user_id] => 38642
[last_post_username] => VCT
[last_thread_id] => 20062
[last_thread_title] => Timing for TSMC Wafer Orders
[last_thread_prefix_id] => 0
[moderate_threads] => 0
[moderate_replies] => 0
[allow_posting] => 1
[count_messages] => 1
[find_new] => 1
[allow_index] => allow
[index_criteria] =>
[field_cache] => []
[prefix_cache] => []
[prompt_cache] => []
[default_prefix_id] => 0
[default_sort_order] => last_post_date
[default_sort_direction] => desc
[list_date_limit_days] => 0
[require_prefix] => 0
[allowed_watch_notifications] => all
[min_tags] => 0
[forum_type_id] => discussion
[type_config] => {"allowed_thread_types":["poll"]}
)
[_relations:protected] => Array
(
[Node] => XF\Entity\Node Object
(
[_uniqueEntityId:XF\Mvc\Entity\Entity:private] => 49
[rootClass:protected] => XF\Entity\Node
[_useReplaceInto:protected] =>
[_newValues:protected] => Array
(
)
[_values:protected] => Array
(
[node_id] => 2
[title] => SemiWiki Main Forum ( Ask the Experts! )
[description] => Post your questions to the experts here!
[node_name] =>
[node_type_id] => Forum
[parent_node_id] => 1
[display_order] => 1
[display_in_list] => 1
[lft] => 2
[rgt] => 3
[depth] => 1
[style_id] => 0
[effective_style_id] => 0
[breadcrumb_data] => {"1":{"node_id":1,"title":"Main Category","depth":0,"lft":1,"node_name":null,"node_type_id":"Category","display_in_list":true}}
[navigation_id] =>
[effective_navigation_id] =>
)
[_relations:protected] => Array
(
)
[_previousValues:protected] => Array
(
)
[_options:protected] => Array
(
)
[_deleted:protected] =>
[_readOnly:protected] =>
[_writePending:protected] =>
[_writeRunning:protected] =>
[_errors:protected] => Array
(
)
[_whenSaveable:protected] => Array
(
)
[_cascadeSave:protected] => Array
(
)
[_behaviors:protected] =>
)
)
[_previousValues:protected] => Array
(
)
[_options:protected] => Array
(
)
[_deleted:protected] =>
[_readOnly:protected] =>
[_writePending:protected] =>
[_writeRunning:protected] =>
[_errors:protected] => Array
(
)
[_whenSaveable:protected] => Array
(
)
[_cascadeSave:protected] => Array
(
)
[_behaviors:protected] =>
)
)
[_previousValues:protected] => Array
(
)
[_options:protected] => Array
(
)
[_deleted:protected] =>
[_readOnly:protected] =>
[_writePending:protected] =>
[_writeRunning:protected] =>
[_errors:protected] => Array
(
)
[_whenSaveable:protected] => Array
(
)
[_cascadeSave:protected] => Array
(
)
[_behaviors:protected] =>
)
[20008] => ThemeHouse\XPress\XF\Entity\Thread Object
(
[_uniqueEntityId:XF\Mvc\Entity\Entity:private] => 115
[rootClass:protected] => XF\Entity\Thread
[_useReplaceInto:protected] =>
[_newValues:protected] => Array
(
)
[_values:protected] => Array
(
[thread_id] => 20008
[node_id] => 2
[title] => TSMC March 2024 Revenue Report
[reply_count] => 11
[view_count] => 989
[user_id] => 5
[username] => Daniel Nenni
[post_date] => 1712751527
[sticky] => 0
[discussion_state] => visible
[discussion_open] => 1
[discussion_type] => discussion
[first_post_id] => 69169
[first_post_reaction_score] => 0
[first_post_reactions] => []
[last_post_date] => 1713890039
[last_post_id] => 69525
[last_post_user_id] => 5
[last_post_username] => Daniel Nenni
[prefix_id] => 0
[tags] => []
[custom_fields] => []
[vote_score] => 0
[vote_count] => 0
[type_data] => []
)
[_relations:protected] => Array
(
[User] => ThemeHouse\XLink\XF\Entity\User Object
(
[_uniqueEntityId:XF\Mvc\Entity\Entity:private] => 60
[rootClass:protected] => XF\Entity\User
[_useReplaceInto:protected] =>
[_newValues:protected] => Array
(
)
[_values:protected] => Array
(
[user_id] => 5
[username] => Daniel Nenni
[username_date] => 0
[username_date_visible] => 0
[email] => dnenni@semiwiki.com
[custom_title] => Admin
[language_id] => 1
[style_id] => 0
[timezone] => America/Los_Angeles
[visible] => 1
[activity_visible] => 1
[user_group_id] => 3
[secondary_group_ids] => 4,5,132
[display_style_group_id] => 3
[permission_combination_id] => 88
[message_count] => 11330
[question_solution_count] => 0
[conversations_unread] => 1
[register_date] => 1280720820
[last_activity] => 1714013314
[last_summary_email_date] => 1605968657
[trophy_points] => 113
[alerts_unviewed] => 25
[alerts_unread] => 25
[avatar_date] => 1663211649
[avatar_width] => 110
[avatar_height] => 107
[avatar_highdpi] => 0
[gravatar] =>
[user_state] => valid
[security_lock] =>
[is_moderator] => 1
[is_admin] => 1
[is_banned] => 0
[reaction_score] => 3387
[warning_points] => 0
[is_staff] => 1
[secret_key] => 0HwyUVVHCwJotUUVEpvqAclfYJdGNPpw
[privacy_policy_accepted] => 0
[terms_accepted] => 0
[vote_score] => 0
)
[_relations:protected] => Array
(
)
[_previousValues:protected] => Array
(
)
[_options:protected] => Array
(
)
[_deleted:protected] =>
[_readOnly:protected] =>
[_writePending:protected] =>
[_writeRunning:protected] =>
[_errors:protected] => Array
(
)
[_whenSaveable:protected] => Array
(
)
[_cascadeSave:protected] => Array
(
)
[_behaviors:protected] =>
)
[Forum] => XF\Entity\Forum Object
(
[_uniqueEntityId:XF\Mvc\Entity\Entity:private] => 50
[rootClass:protected] => XF\Entity\Forum
[_useReplaceInto:protected] =>
[_newValues:protected] => Array
(
)
[_values:protected] => Array
(
[node_id] => 2
[discussion_count] => 5728
[message_count] => 35429
[last_post_id] => 69608
[last_post_date] => 1714021137
[last_post_user_id] => 38642
[last_post_username] => VCT
[last_thread_id] => 20062
[last_thread_title] => Timing for TSMC Wafer Orders
[last_thread_prefix_id] => 0
[moderate_threads] => 0
[moderate_replies] => 0
[allow_posting] => 1
[count_messages] => 1
[find_new] => 1
[allow_index] => allow
[index_criteria] =>
[field_cache] => []
[prefix_cache] => []
[prompt_cache] => []
[default_prefix_id] => 0
[default_sort_order] => last_post_date
[default_sort_direction] => desc
[list_date_limit_days] => 0
[require_prefix] => 0
[allowed_watch_notifications] => all
[min_tags] => 0
[forum_type_id] => discussion
[type_config] => {"allowed_thread_types":["poll"]}
)
[_relations:protected] => Array
(
[Node] => XF\Entity\Node Object
(
[_uniqueEntityId:XF\Mvc\Entity\Entity:private] => 49
[rootClass:protected] => XF\Entity\Node
[_useReplaceInto:protected] =>
[_newValues:protected] => Array
(
)
[_values:protected] => Array
(
[node_id] => 2
[title] => SemiWiki Main Forum ( Ask the Experts! )
[description] => Post your questions to the experts here!
[node_name] =>
[node_type_id] => Forum
[parent_node_id] => 1
[display_order] => 1
[display_in_list] => 1
[lft] => 2
[rgt] => 3
[depth] => 1
[style_id] => 0
[effective_style_id] => 0
[breadcrumb_data] => {"1":{"node_id":1,"title":"Main Category","depth":0,"lft":1,"node_name":null,"node_type_id":"Category","display_in_list":true}}
[navigation_id] =>
[effective_navigation_id] =>
)
[_relations:protected] => Array
(
)
[_previousValues:protected] => Array
(
)
[_options:protected] => Array
(
)
[_deleted:protected] =>
[_readOnly:protected] =>
[_writePending:protected] =>
[_writeRunning:protected] =>
[_errors:protected] => Array
(
)
[_whenSaveable:protected] => Array
(
)
[_cascadeSave:protected] => Array
(
)
[_behaviors:protected] =>
)
)
[_previousValues:protected] => Array
(
)
[_options:protected] => Array
(
)
[_deleted:protected] =>
[_readOnly:protected] =>
[_writePending:protected] =>
[_writeRunning:protected] =>
[_errors:protected] => Array
(
)
[_whenSaveable:protected] => Array
(
)
[_cascadeSave:protected] => Array
(
)
[_behaviors:protected] =>
)
)
[_previousValues:protected] => Array
(
)
[_options:protected] => Array
(
)
[_deleted:protected] =>
[_readOnly:protected] =>
[_writePending:protected] =>
[_writeRunning:protected] =>
[_errors:protected] => Array
(
)
[_whenSaveable:protected] => Array
(
)
[_cascadeSave:protected] => Array
(
)
[_behaviors:protected] =>
)
[20091] => ThemeHouse\XPress\XF\Entity\Thread Object
(
[_uniqueEntityId:XF\Mvc\Entity\Entity:private] => 119
[rootClass:protected] => XF\Entity\Thread
[_useReplaceInto:protected] =>
[_newValues:protected] => Array
(
)
[_values:protected] => Array
(
[thread_id] => 20091
[node_id] => 2
[title] => Apple Not Adopting TSMC 2nm for iPhone 17? A19 Pro Chip Rumored to Use N3P Process
[reply_count] => 2
[view_count] => 366
[user_id] => 5
[username] => Daniel Nenni
[post_date] => 1713885480
[sticky] => 0
[discussion_state] => visible
[discussion_open] => 1
[discussion_type] => discussion
[first_post_id] => 69521
[first_post_reaction_score] => 1
[first_post_reactions] => {"3":1}
[last_post_date] => 1713889923
[last_post_id] => 69524
[last_post_user_id] => 170880
[last_post_username] => nghanayem
[prefix_id] => 0
[tags] => []
[custom_fields] => []
[vote_score] => 0
[vote_count] => 0
[type_data] => []
)
[_relations:protected] => Array
(
[User] => ThemeHouse\XLink\XF\Entity\User Object
(
[_uniqueEntityId:XF\Mvc\Entity\Entity:private] => 60
[rootClass:protected] => XF\Entity\User
[_useReplaceInto:protected] =>
[_newValues:protected] => Array
(
)
[_values:protected] => Array
(
[user_id] => 5
[username] => Daniel Nenni
[username_date] => 0
[username_date_visible] => 0
[email] => dnenni@semiwiki.com
[custom_title] => Admin
[language_id] => 1
[style_id] => 0
[timezone] => America/Los_Angeles
[visible] => 1
[activity_visible] => 1
[user_group_id] => 3
[secondary_group_ids] => 4,5,132
[display_style_group_id] => 3
[permission_combination_id] => 88
[message_count] => 11330
[question_solution_count] => 0
[conversations_unread] => 1
[register_date] => 1280720820
[last_activity] => 1714013314
[last_summary_email_date] => 1605968657
[trophy_points] => 113
[alerts_unviewed] => 25
[alerts_unread] => 25
[avatar_date] => 1663211649
[avatar_width] => 110
[avatar_height] => 107
[avatar_highdpi] => 0
[gravatar] =>
[user_state] => valid
[security_lock] =>
[is_moderator] => 1
[is_admin] => 1
[is_banned] => 0
[reaction_score] => 3387
[warning_points] => 0
[is_staff] => 1
[secret_key] => 0HwyUVVHCwJotUUVEpvqAclfYJdGNPpw
[privacy_policy_accepted] => 0
[terms_accepted] => 0
[vote_score] => 0
)
[_relations:protected] => Array
(
)
[_previousValues:protected] => Array
(
)
[_options:protected] => Array
(
)
[_deleted:protected] =>
[_readOnly:protected] =>
[_writePending:protected] =>
[_writeRunning:protected] =>
[_errors:protected] => Array
(
)
[_whenSaveable:protected] => Array
(
)
[_cascadeSave:protected] => Array
(
)
[_behaviors:protected] =>
)
[Forum] => XF\Entity\Forum Object
(
[_uniqueEntityId:XF\Mvc\Entity\Entity:private] => 50
[rootClass:protected] => XF\Entity\Forum
[_useReplaceInto:protected] =>
[_newValues:protected] => Array
(
)
[_values:protected] => Array
(
[node_id] => 2
[discussion_count] => 5728
[message_count] => 35429
[last_post_id] => 69608
[last_post_date] => 1714021137
[last_post_user_id] => 38642
[last_post_username] => VCT
[last_thread_id] => 20062
[last_thread_title] => Timing for TSMC Wafer Orders
[last_thread_prefix_id] => 0
[moderate_threads] => 0
[moderate_replies] => 0
[allow_posting] => 1
[count_messages] => 1
[find_new] => 1
[allow_index] => allow
[index_criteria] =>
[field_cache] => []
[prefix_cache] => []
[prompt_cache] => []
[default_prefix_id] => 0
[default_sort_order] => last_post_date
[default_sort_direction] => desc
[list_date_limit_days] => 0
[require_prefix] => 0
[allowed_watch_notifications] => all
[min_tags] => 0
[forum_type_id] => discussion
[type_config] => {"allowed_thread_types":["poll"]}
)
[_relations:protected] => Array
(
[Node] => XF\Entity\Node Object
(
[_uniqueEntityId:XF\Mvc\Entity\Entity:private] => 49
[rootClass:protected] => XF\Entity\Node
[_useReplaceInto:protected] =>
[_newValues:protected] => Array
(
)
[_values:protected] => Array
(
[node_id] => 2
[title] => SemiWiki Main Forum ( Ask the Experts! )
[description] => Post your questions to the experts here!
[node_name] =>
[node_type_id] => Forum
[parent_node_id] => 1
[display_order] => 1
[display_in_list] => 1
[lft] => 2
[rgt] => 3
[depth] => 1
[style_id] => 0
[effective_style_id] => 0
[breadcrumb_data] => {"1":{"node_id":1,"title":"Main Category","depth":0,"lft":1,"node_name":null,"node_type_id":"Category","display_in_list":true}}
[navigation_id] =>
[effective_navigation_id] =>
)
[_relations:protected] => Array
(
)
[_previousValues:protected] => Array
(
)
[_options:protected] => Array
(
)
[_deleted:protected] =>
[_readOnly:protected] =>
[_writePending:protected] =>
[_writeRunning:protected] =>
[_errors:protected] => Array
(
)
[_whenSaveable:protected] => Array
(
)
[_cascadeSave:protected] => Array
(
)
[_behaviors:protected] =>
)
)
[_previousValues:protected] => Array
(
)
[_options:protected] => Array
(
)
[_deleted:protected] =>
[_readOnly:protected] =>
[_writePending:protected] =>
[_writeRunning:protected] =>
[_errors:protected] => Array
(
)
[_whenSaveable:protected] => Array
(
)
[_cascadeSave:protected] => Array
(
)
[_behaviors:protected] =>
)
)
[_previousValues:protected] => Array
(
)
[_options:protected] => Array
(
)
[_deleted:protected] =>
[_readOnly:protected] =>
[_writePending:protected] =>
[_writeRunning:protected] =>
[_errors:protected] => Array
(
)
[_whenSaveable:protected] => Array
(
)
[_cascadeSave:protected] => Array
(
)
[_behaviors:protected] =>
)
[20059] => ThemeHouse\XPress\XF\Entity\Thread Object
(
[_uniqueEntityId:XF\Mvc\Entity\Entity:private] => 123
[rootClass:protected] => XF\Entity\Thread
[_useReplaceInto:protected] =>
[_newValues:protected] => Array
(
)
[_values:protected] => Array
(
[thread_id] => 20059
[node_id] => 2
[title] => Intel is industry’s first mover on High NA EUV lithography system.
[reply_count] => 22
[view_count] => 2867
[user_id] => 5
[username] => Daniel Nenni
[post_date] => 1713453303
[sticky] => 0
[discussion_state] => visible
[discussion_open] => 1
[discussion_type] => discussion
[first_post_id] => 69412
[first_post_reaction_score] => 1
[first_post_reactions] => {"1":1}
[last_post_date] => 1713873204
[last_post_id] => 69520
[last_post_user_id] => 35301
[last_post_username] => Xebec
[prefix_id] => 0
[tags] => []
[custom_fields] => []
[vote_score] => 0
[vote_count] => 0
[type_data] => []
)
[_relations:protected] => Array
(
[User] => ThemeHouse\XLink\XF\Entity\User Object
(
[_uniqueEntityId:XF\Mvc\Entity\Entity:private] => 60
[rootClass:protected] => XF\Entity\User
[_useReplaceInto:protected] =>
[_newValues:protected] => Array
(
)
[_values:protected] => Array
(
[user_id] => 5
[username] => Daniel Nenni
[username_date] => 0
[username_date_visible] => 0
[email] => dnenni@semiwiki.com
[custom_title] => Admin
[language_id] => 1
[style_id] => 0
[timezone] => America/Los_Angeles
[visible] => 1
[activity_visible] => 1
[user_group_id] => 3
[secondary_group_ids] => 4,5,132
[display_style_group_id] => 3
[permission_combination_id] => 88
[message_count] => 11330
[question_solution_count] => 0
[conversations_unread] => 1
[register_date] => 1280720820
[last_activity] => 1714013314
[last_summary_email_date] => 1605968657
[trophy_points] => 113
[alerts_unviewed] => 25
[alerts_unread] => 25
[avatar_date] => 1663211649
[avatar_width] => 110
[avatar_height] => 107
[avatar_highdpi] => 0
[gravatar] =>
[user_state] => valid
[security_lock] =>
[is_moderator] => 1
[is_admin] => 1
[is_banned] => 0
[reaction_score] => 3387
[warning_points] => 0
[is_staff] => 1
[secret_key] => 0HwyUVVHCwJotUUVEpvqAclfYJdGNPpw
[privacy_policy_accepted] => 0
[terms_accepted] => 0
[vote_score] => 0
)
[_relations:protected] => Array
(
)
[_previousValues:protected] => Array
(
)
[_options:protected] => Array
(
)
[_deleted:protected] =>
[_readOnly:protected] =>
[_writePending:protected] =>
[_writeRunning:protected] =>
[_errors:protected] => Array
(
)
[_whenSaveable:protected] => Array
(
)
[_cascadeSave:protected] => Array
(
)
[_behaviors:protected] =>
)
[Forum] => XF\Entity\Forum Object
(
[_uniqueEntityId:XF\Mvc\Entity\Entity:private] => 50
[rootClass:protected] => XF\Entity\Forum
[_useReplaceInto:protected] =>
[_newValues:protected] => Array
(
)
[_values:protected] => Array
(
[node_id] => 2
[discussion_count] => 5728
[message_count] => 35429
[last_post_id] => 69608
[last_post_date] => 1714021137
[last_post_user_id] => 38642
[last_post_username] => VCT
[last_thread_id] => 20062
[last_thread_title] => Timing for TSMC Wafer Orders
[last_thread_prefix_id] => 0
[moderate_threads] => 0
[moderate_replies] => 0
[allow_posting] => 1
[count_messages] => 1
[find_new] => 1
[allow_index] => allow
[index_criteria] =>
[field_cache] => []
[prefix_cache] => []
[prompt_cache] => []
[default_prefix_id] => 0
[default_sort_order] => last_post_date
[default_sort_direction] => desc
[list_date_limit_days] => 0
[require_prefix] => 0
[allowed_watch_notifications] => all
[min_tags] => 0
[forum_type_id] => discussion
[type_config] => {"allowed_thread_types":["poll"]}
)
[_relations:protected] => Array
(
[Node] => XF\Entity\Node Object
(
[_uniqueEntityId:XF\Mvc\Entity\Entity:private] => 49
[rootClass:protected] => XF\Entity\Node
[_useReplaceInto:protected] =>
[_newValues:protected] => Array
(
)
[_values:protected] => Array
(
[node_id] => 2
[title] => SemiWiki Main Forum ( Ask the Experts! )
[description] => Post your questions to the experts here!
[node_name] =>
[node_type_id] => Forum
[parent_node_id] => 1
[display_order] => 1
[display_in_list] => 1
[lft] => 2
[rgt] => 3
[depth] => 1
[style_id] => 0
[effective_style_id] => 0
[breadcrumb_data] => {"1":{"node_id":1,"title":"Main Category","depth":0,"lft":1,"node_name":null,"node_type_id":"Category","display_in_list":true}}
[navigation_id] =>
[effective_navigation_id] =>
)
[_relations:protected] => Array
(
)
[_previousValues:protected] => Array
(
)
[_options:protected] => Array
(
)
[_deleted:protected] =>
[_readOnly:protected] =>
[_writePending:protected] =>
[_writeRunning:protected] =>
[_errors:protected] => Array
(
)
[_whenSaveable:protected] => Array
(
)
[_cascadeSave:protected] => Array
(
)
[_behaviors:protected] =>
)
)
[_previousValues:protected] => Array
(
)
[_options:protected] => Array
(
)
[_deleted:protected] =>
[_readOnly:protected] =>
[_writePending:protected] =>
[_writeRunning:protected] =>
[_errors:protected] => Array
(
)
[_whenSaveable:protected] => Array
(
)
[_cascadeSave:protected] => Array
(
)
[_behaviors:protected] =>
)
)
[_previousValues:protected] => Array
(
)
[_options:protected] => Array
(
)
[_deleted:protected] =>
[_readOnly:protected] =>
[_writePending:protected] =>
[_writeRunning:protected] =>
[_errors:protected] => Array
(
)
[_whenSaveable:protected] => Array
(
)
[_cascadeSave:protected] => Array
(
)
[_behaviors:protected] =>
)
[20032] => ThemeHouse\XPress\XF\Entity\Thread Object
(
[_uniqueEntityId:XF\Mvc\Entity\Entity:private] => 127
[rootClass:protected] => XF\Entity\Thread
[_useReplaceInto:protected] =>
[_newValues:protected] => Array
(
)
[_values:protected] => Array
(
[thread_id] => 20032
[node_id] => 2
[title] => Biden-Harris Administration Announces Preliminary Terms with Samsung Electronics to Establish Leading-Edge Semiconductor Ecosystem in Central Texas
[reply_count] => 11
[view_count] => 1164
[user_id] => 5
[username] => Daniel Nenni
[post_date] => 1713186549
[sticky] => 0
[discussion_state] => visible
[discussion_open] => 1
[discussion_type] => discussion
[first_post_id] => 69307
[first_post_reaction_score] => 1
[first_post_reactions] => {"1":1}
[last_post_date] => 1713806935
[last_post_id] => 69491
[last_post_user_id] => 1305
[last_post_username] => KevinK
[prefix_id] => 0
[tags] => []
[custom_fields] => []
[vote_score] => 0
[vote_count] => 0
[type_data] => []
)
[_relations:protected] => Array
(
[User] => ThemeHouse\XLink\XF\Entity\User Object
(
[_uniqueEntityId:XF\Mvc\Entity\Entity:private] => 60
[rootClass:protected] => XF\Entity\User
[_useReplaceInto:protected] =>
[_newValues:protected] => Array
(
)
[_values:protected] => Array
(
[user_id] => 5
[username] => Daniel Nenni
[username_date] => 0
[username_date_visible] => 0
[email] => dnenni@semiwiki.com
[custom_title] => Admin
[language_id] => 1
[style_id] => 0
[timezone] => America/Los_Angeles
[visible] => 1
[activity_visible] => 1
[user_group_id] => 3
[secondary_group_ids] => 4,5,132
[display_style_group_id] => 3
[permission_combination_id] => 88
[message_count] => 11330
[question_solution_count] => 0
[conversations_unread] => 1
[register_date] => 1280720820
[last_activity] => 1714013314
[last_summary_email_date] => 1605968657
[trophy_points] => 113
[alerts_unviewed] => 25
[alerts_unread] => 25
[avatar_date] => 1663211649
[avatar_width] => 110
[avatar_height] => 107
[avatar_highdpi] => 0
[gravatar] =>
[user_state] => valid
[security_lock] =>
[is_moderator] => 1
[is_admin] => 1
[is_banned] => 0
[reaction_score] => 3387
[warning_points] => 0
[is_staff] => 1
[secret_key] => 0HwyUVVHCwJotUUVEpvqAclfYJdGNPpw
[privacy_policy_accepted] => 0
[terms_accepted] => 0
[vote_score] => 0
)
[_relations:protected] => Array
(
)
[_previousValues:protected] => Array
(
)
[_options:protected] => Array
(
)
[_deleted:protected] =>
[_readOnly:protected] =>
[_writePending:protected] =>
[_writeRunning:protected] =>
[_errors:protected] => Array
(
)
[_whenSaveable:protected] => Array
(
)
[_cascadeSave:protected] => Array
(
)
[_behaviors:protected] =>
)
[Forum] => XF\Entity\Forum Object
(
[_uniqueEntityId:XF\Mvc\Entity\Entity:private] => 50
[rootClass:protected] => XF\Entity\Forum
[_useReplaceInto:protected] =>
[_newValues:protected] => Array
(
)
[_values:protected] => Array
(
[node_id] => 2
[discussion_count] => 5728
[message_count] => 35429
[last_post_id] => 69608
[last_post_date] => 1714021137
[last_post_user_id] => 38642
[last_post_username] => VCT
[last_thread_id] => 20062
[last_thread_title] => Timing for TSMC Wafer Orders
[last_thread_prefix_id] => 0
[moderate_threads] => 0
[moderate_replies] => 0
[allow_posting] => 1
[count_messages] => 1
[find_new] => 1
[allow_index] => allow
[index_criteria] =>
[field_cache] => []
[prefix_cache] => []
[prompt_cache] => []
[default_prefix_id] => 0
[default_sort_order] => last_post_date
[default_sort_direction] => desc
[list_date_limit_days] => 0
[require_prefix] => 0
[allowed_watch_notifications] => all
[min_tags] => 0
[forum_type_id] => discussion
[type_config] => {"allowed_thread_types":["poll"]}
)
[_relations:protected] => Array
(
[Node] => XF\Entity\Node Object
(
[_uniqueEntityId:XF\Mvc\Entity\Entity:private] => 49
[rootClass:protected] => XF\Entity\Node
[_useReplaceInto:protected] =>
[_newValues:protected] => Array
(
)
[_values:protected] => Array
(
[node_id] => 2
[title] => SemiWiki Main Forum ( Ask the Experts! )
[description] => Post your questions to the experts here!
[node_name] =>
[node_type_id] => Forum
[parent_node_id] => 1
[display_order] => 1
[display_in_list] => 1
[lft] => 2
[rgt] => 3
[depth] => 1
[style_id] => 0
[effective_style_id] => 0
[breadcrumb_data] => {"1":{"node_id":1,"title":"Main Category","depth":0,"lft":1,"node_name":null,"node_type_id":"Category","display_in_list":true}}
[navigation_id] =>
[effective_navigation_id] =>
)
[_relations:protected] => Array
(
)
[_previousValues:protected] => Array
(
)
[_options:protected] => Array
(
)
[_deleted:protected] =>
[_readOnly:protected] =>
[_writePending:protected] =>
[_writeRunning:protected] =>
[_errors:protected] => Array
(
)
[_whenSaveable:protected] => Array
(
)
[_cascadeSave:protected] => Array
(
)
[_behaviors:protected] =>
)
)
[_previousValues:protected] => Array
(
)
[_options:protected] => Array
(
)
[_deleted:protected] =>
[_readOnly:protected] =>
[_writePending:protected] =>
[_writeRunning:protected] =>
[_errors:protected] => Array
(
)
[_whenSaveable:protected] => Array
(
)
[_cascadeSave:protected] => Array
(
)
[_behaviors:protected] =>
)
)
[_previousValues:protected] => Array
(
)
[_options:protected] => Array
(
)
[_deleted:protected] =>
[_readOnly:protected] =>
[_writePending:protected] =>
[_writeRunning:protected] =>
[_errors:protected] => Array
(
)
[_whenSaveable:protected] => Array
(
)
[_cascadeSave:protected] => Array
(
)
[_behaviors:protected] =>
)
)
[populated:protected] => 1
)
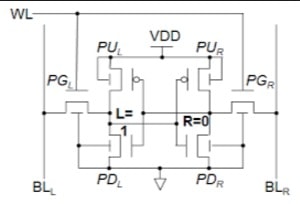


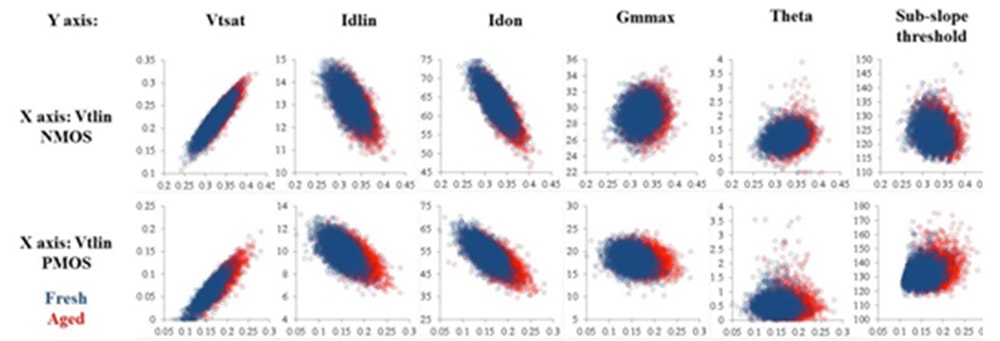
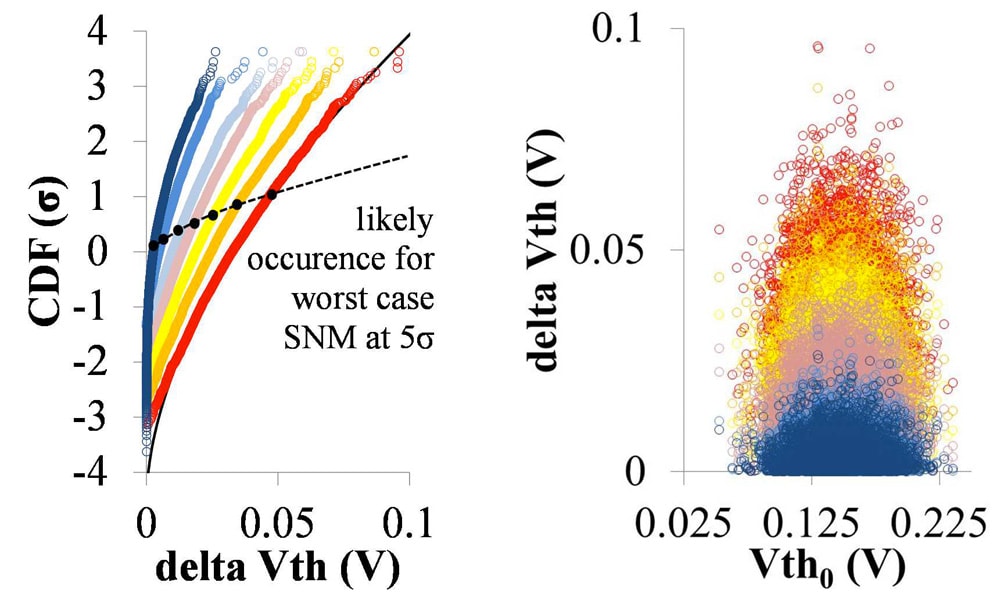
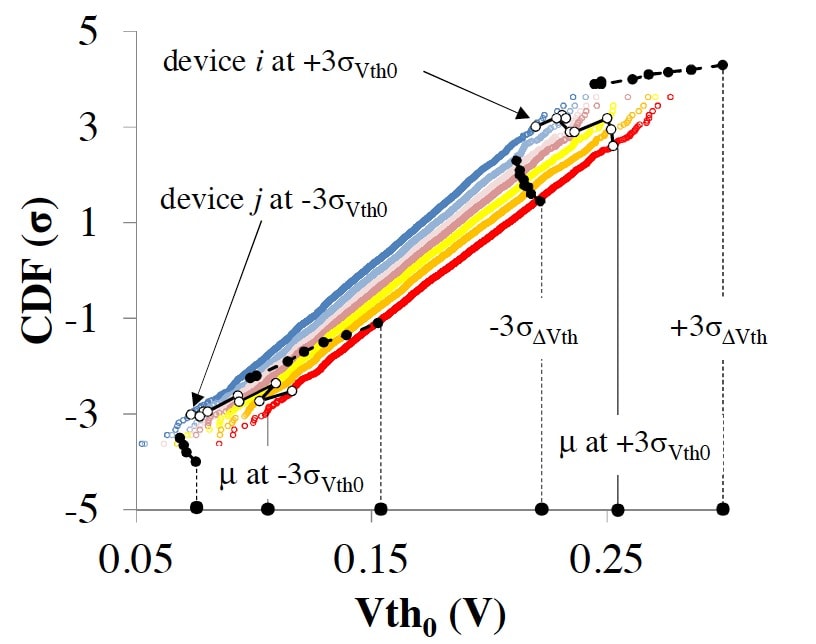
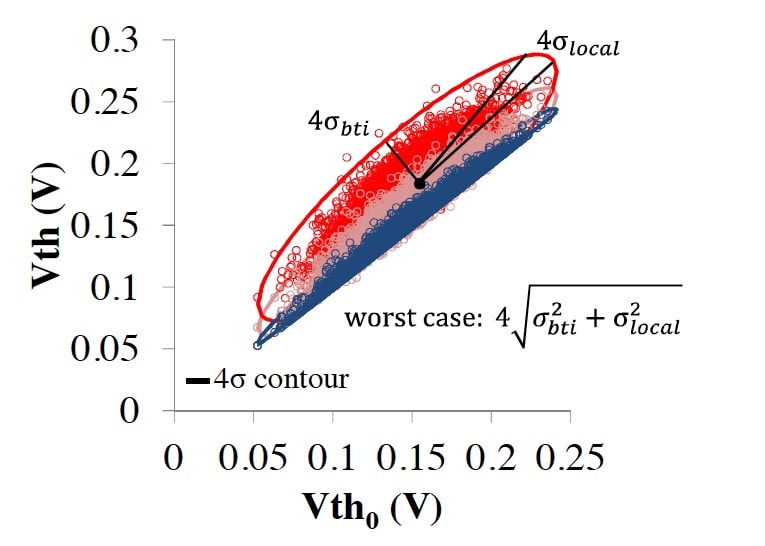
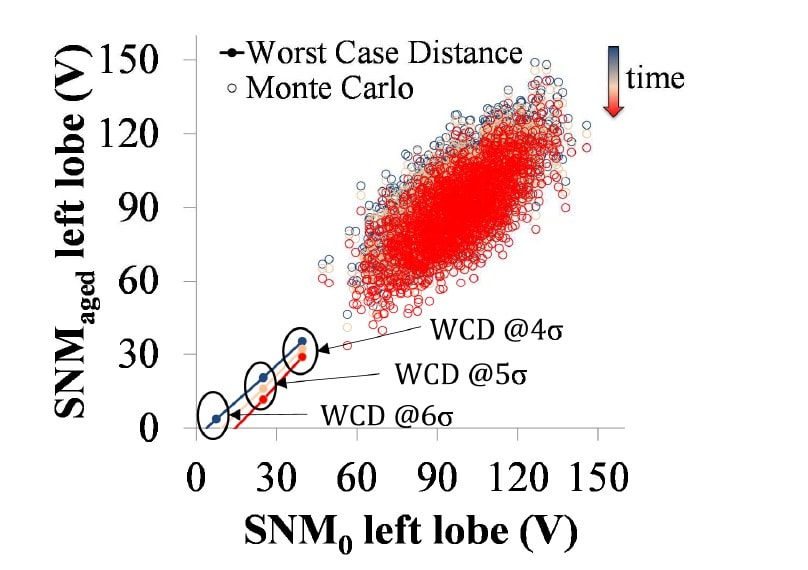
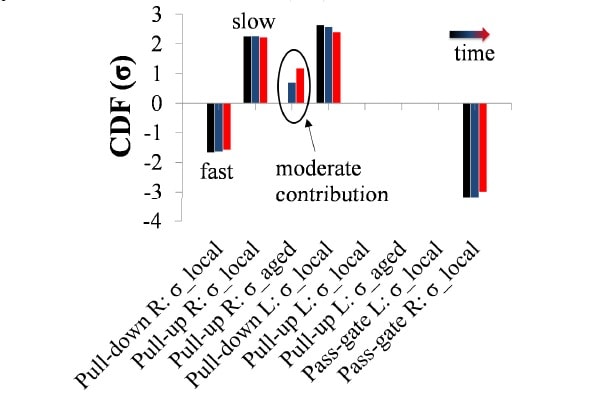
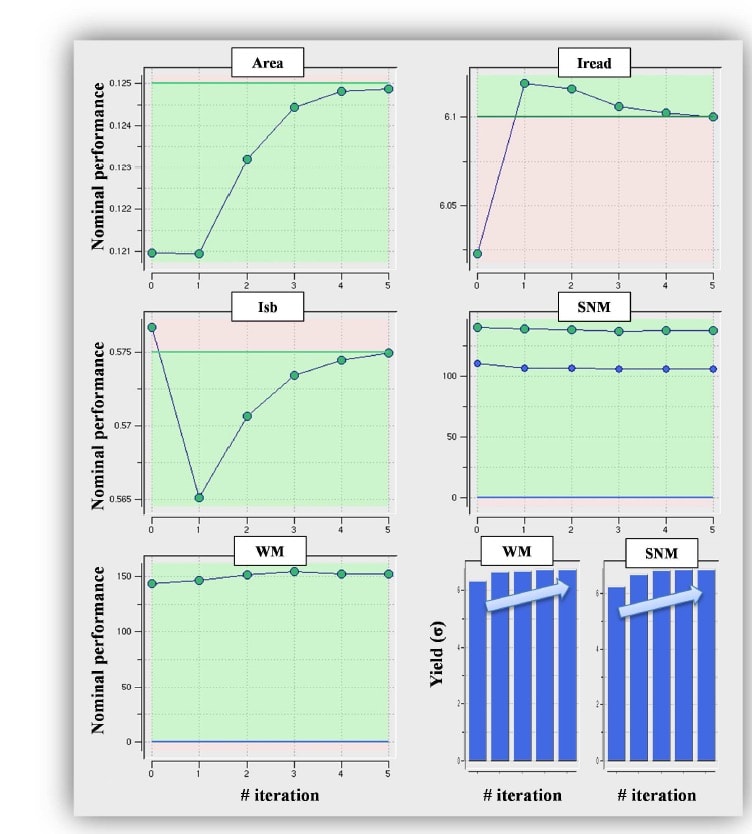


Comments
There are no comments yet.
You must register or log in to view/post comments.